Temperature
The Temperature page offers a comprehensive overview of temperature excursions in all selected shipments as well as trends in temperature excursions.
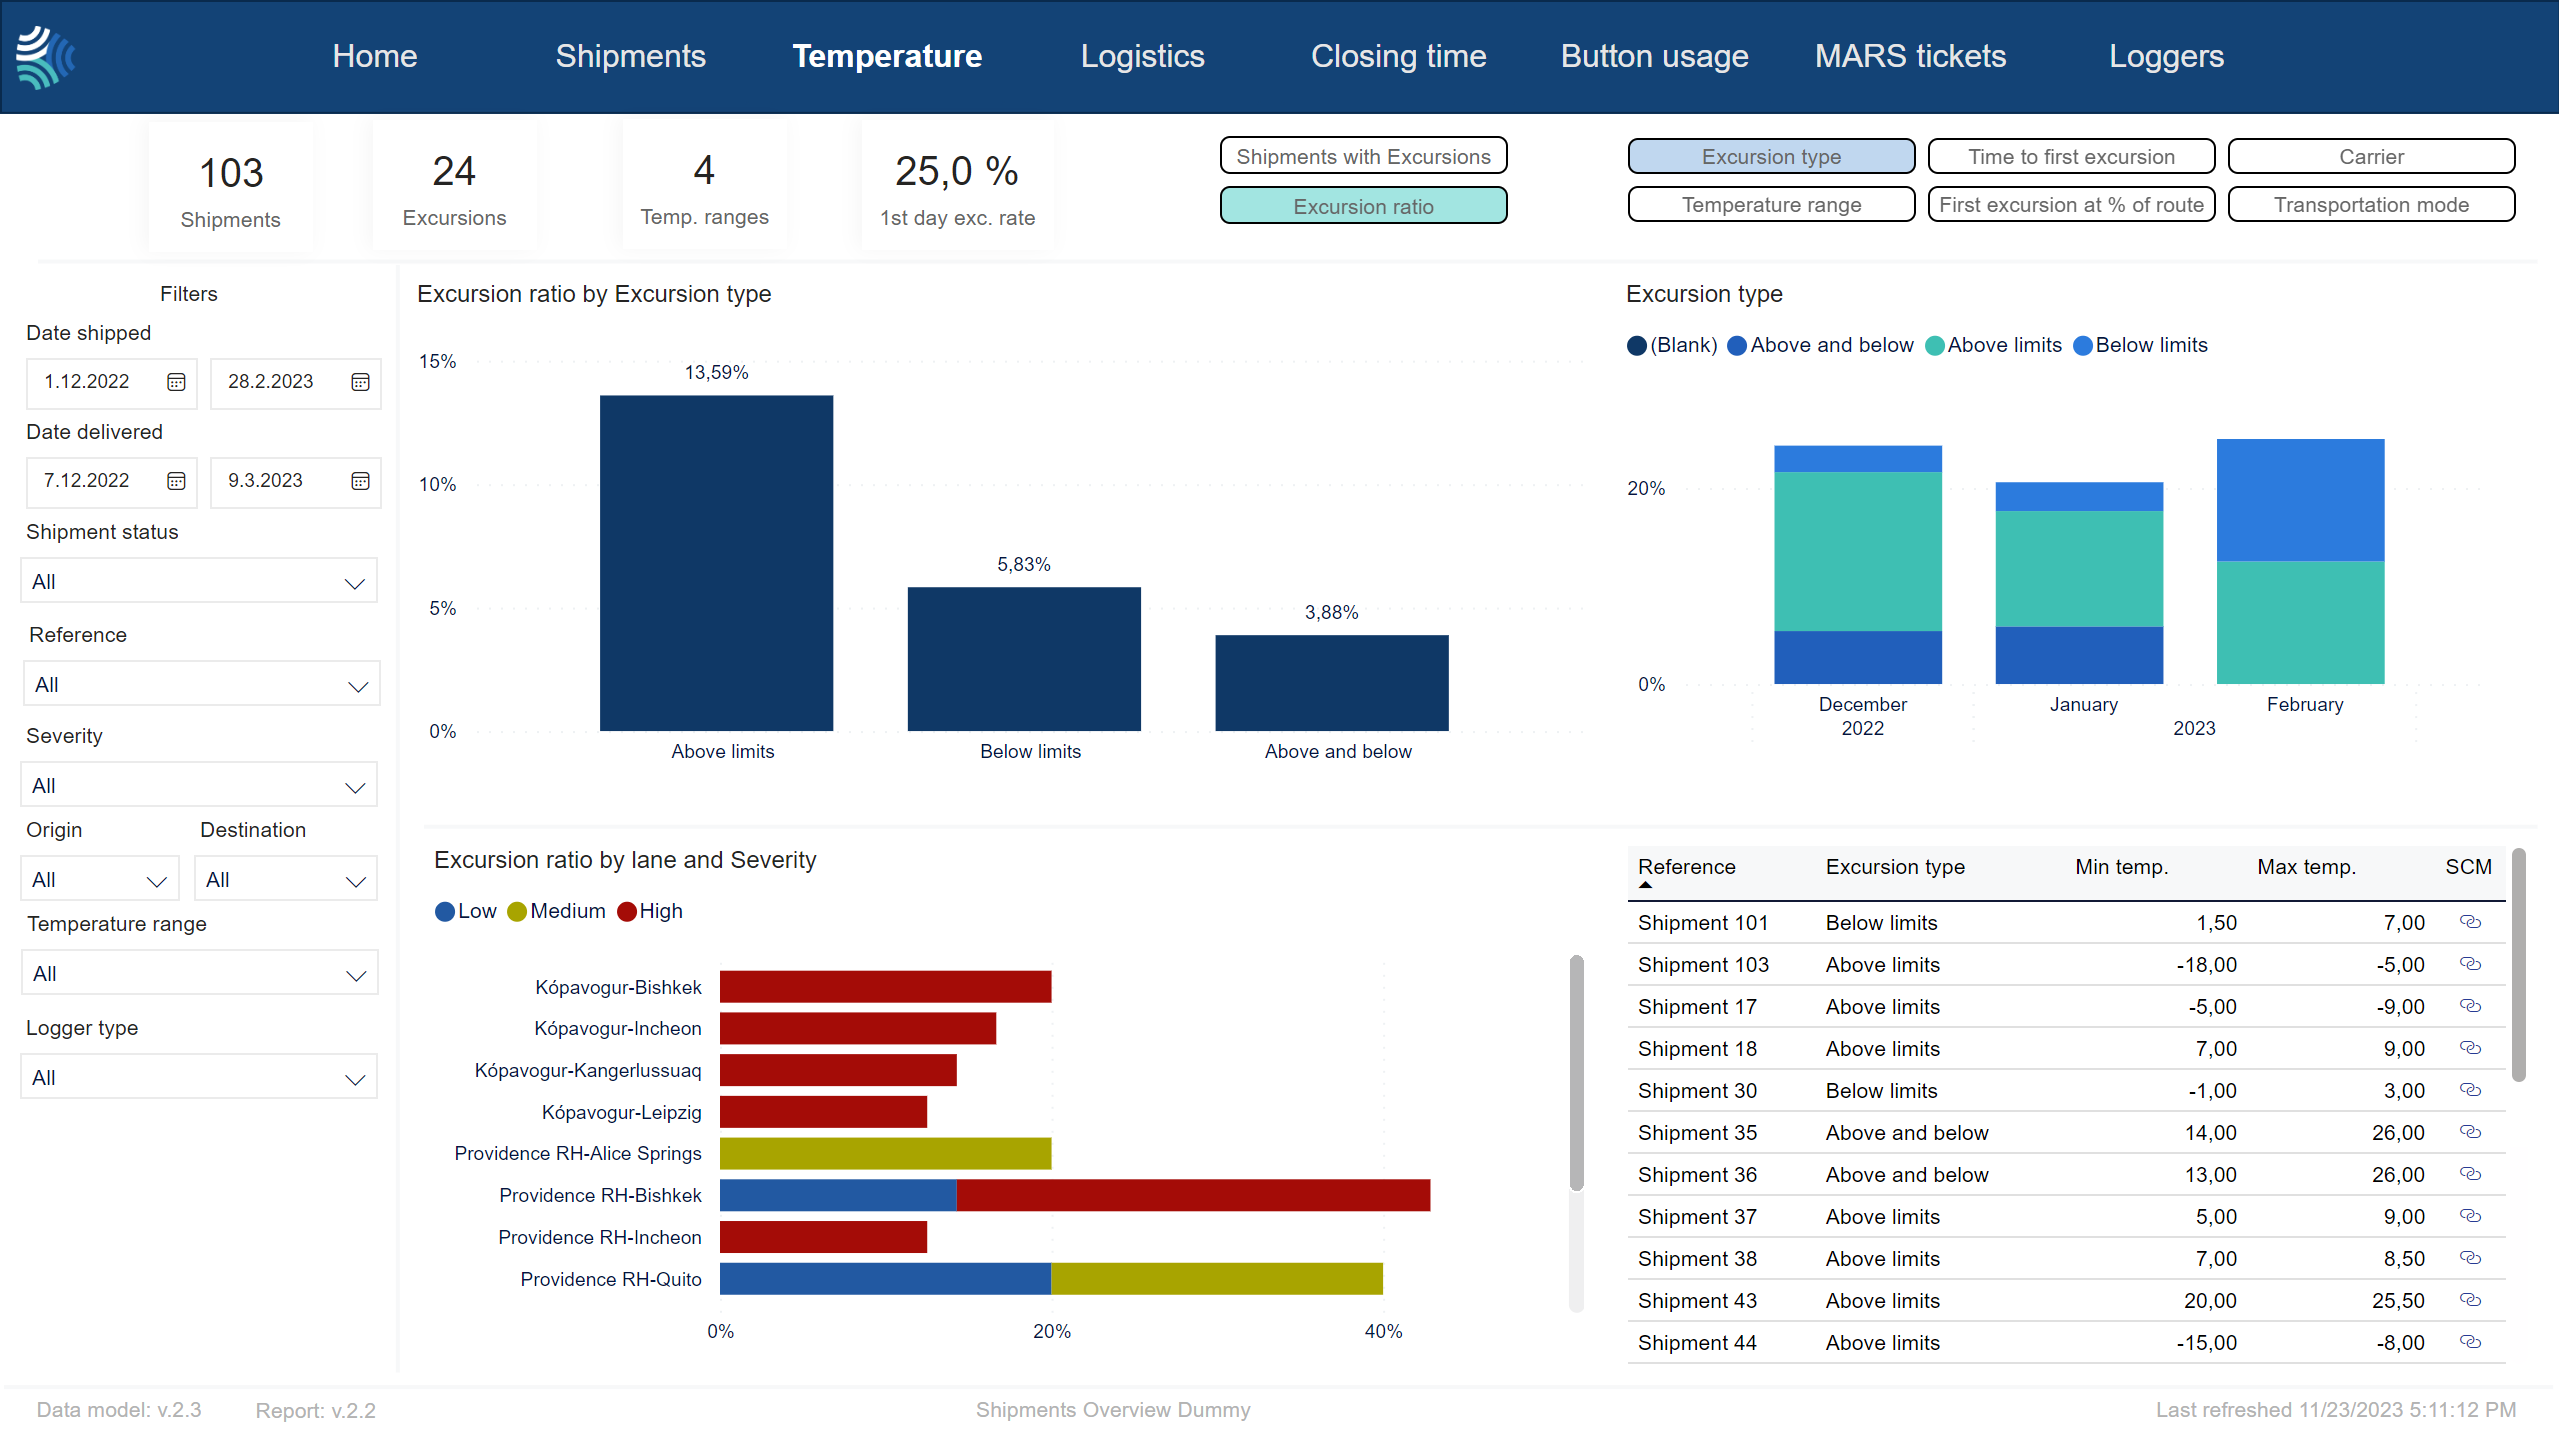
Temperature KPIs
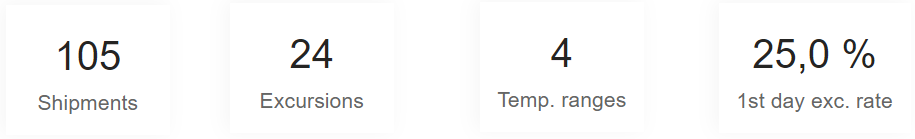
Key performance indicators for temperature for selected shipments.
Item | Description |
|---|---|
Shipments | |
Excursions | |
Temp. ranges | Number of temperature ranges in shipments. |
1st day exc. rate | Percentage of shipments with excursions that had the first excursion within the first 24 hours of the shipment. |
Note
Not all customers have the same filters. You may not see all of the following filters, and you may have filters not included below.
Tip
For any filter, to clear it, click  .
.
You can use the filter to select shipments data to include in the report using the following criteria:
Item | Description |
|---|---|
Date shipped | Date range for the date shipment was started, in Type a date, or click
|
Date delivered | Date range for the date shipment was delivered, in Type a date, or click
|
Reference | Reference to unique identifier of shipment in customer's system. Click to select, or press CTRL and click to select more than one from the list. |
Severity | Severity of excursion. Click to select, or press CTRL and click to select more than one of the following: |
Status | Current status of shipment. Click to select, or press CTRL and click to select more than one of the following: |
Origin | Origin of shipment. Click to select, or press CTRL and click to select more than one from the list. |
Destination | Destination of shipment. Click to select, or press CTRL and click to select more than one from the list. |
Temperature range/ Stowage condition | Temperature range to filter for. Click to select, or press CTRL and click to select more than one from the list. |
Transportation mode | Transportation mode. Click to select, or press CTRL and click to select more than one from the list. Options include:
|
Carrier | Name of carrier. |
Logger type | Type of device. Click to select, or press CTRL and click to select more than one from the list. |

This section of the report contains details about the type of excursions that have occurred in selected shipments.
Tip
You can choose between graphs showing the number of shipments with each type of excursion, or the ratio of shipments with each type of excursion out of all shipments.
Shipments with excursions by excursion type | Excursion ratio by excursion type |
|---|---|
To see Shipments with excursions by excursion type, in the Excursion type sub-tab, click Shipments with excursions.  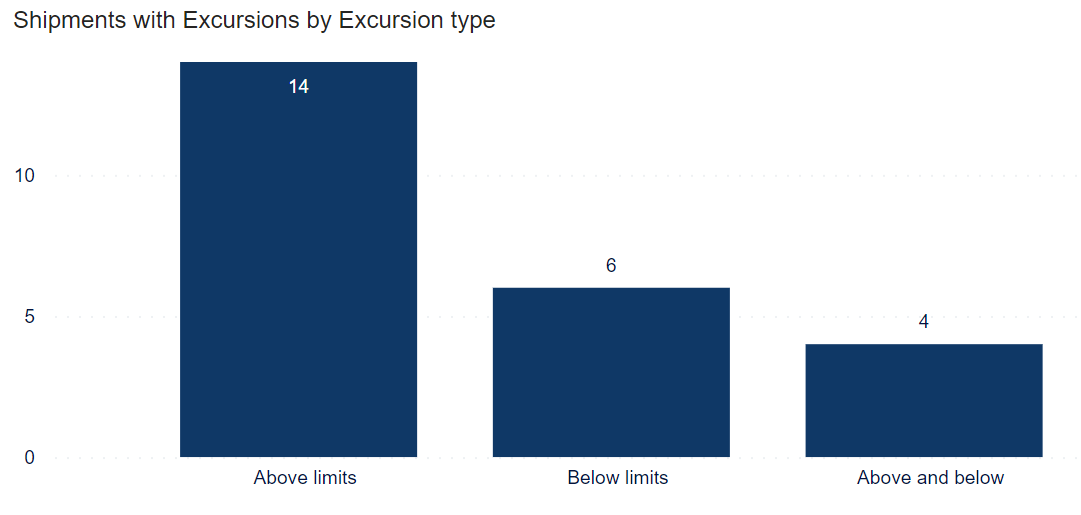 Number of shipments with excursions, by type of excursion. | To see Excursion ratio by excursion type, in the Excursion type sub-tab, click Excursion ratio.  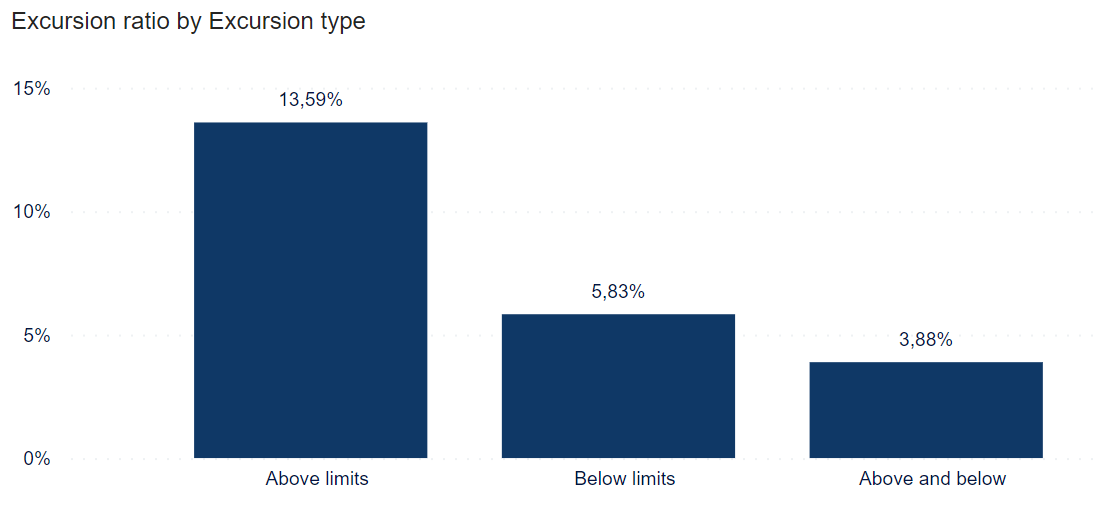 Ratio of shipments with excursions as a percentage of all shipments. |
Type of excursion. One of the following:
Excursion type by number of excursions | Excursion type by ratio of excursions |
|---|---|
To see Excursion type by month and type of excursion, in the Excursion type sub-tab, click Shipments with excursions. 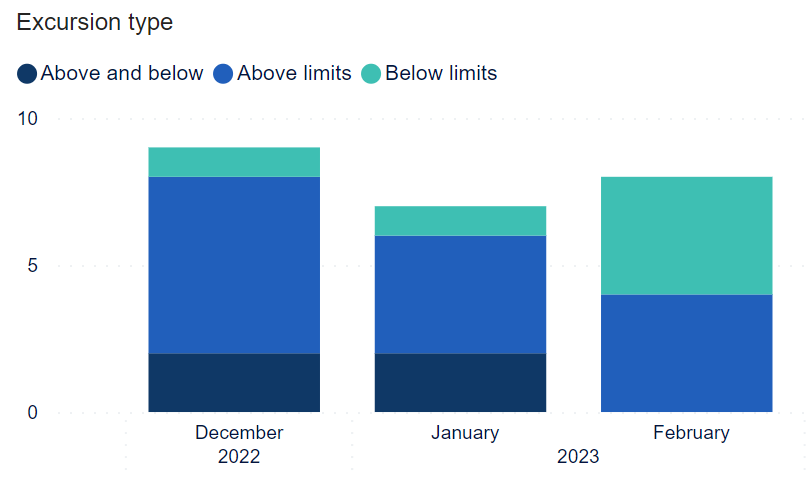 Number of shipments with excursions, by month and type of excursion. | To see Excursion ratio by month and type of excursion, in the Excursion type sub-tab, click Excursion ratio. Ratio of shipments with excursions, by month and type of excursion. |
Type of excursion. One of the following:
Shipments with excursions by lane and severity | Excursion ratio by by lane and severity |
|---|---|
To see Shipments with excursions by lane and severity, in the sub-tab, click Shipments with excursions. 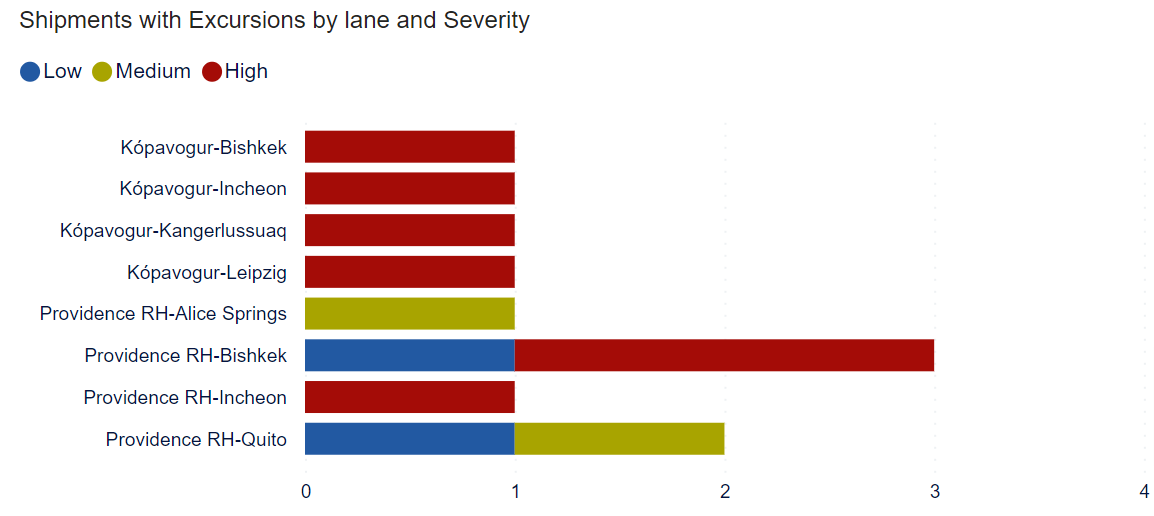 Number of shipments with excursions by lane and severity. | To see Excursion ratio by lane and severity, in the sub-tab, click Excursion ratio. 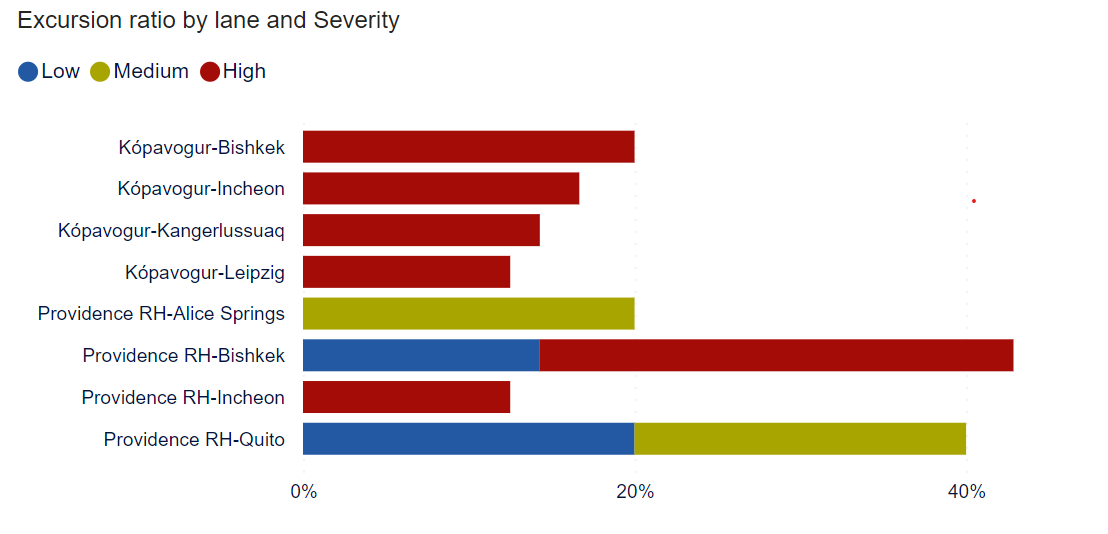 Ratio of shipments with excursions by lane and severity. |
Severity level. One of the following:
Low
Medium
High
Details about selected shipments that have had temperature excursions.
Item | Description |
|---|---|
Reference | Reference to unique identifier of shipment in customer's system. |
Excursion type | Type of excursion this shipment had: |
Min temp. | Minimum temperature logged for shipment. |
Max temp. | Maximum temperature logged for shipment. |
SCM | Link to shipment in Controlant Platform (SCM). |
This section of the report contains details about the temperature range in selected shipments.
Tip
You can choose between graphs showing the number of shipments with each type of excursion, or the ratio of shipments with each type of excursion out of all shipments.
Shipments with excursions by temperature range | Excursion ratio by temperature range |
|---|---|
To see Shipments with excursions by temperature range, in the Temperature range sub-tab, click Shipments with excursions. 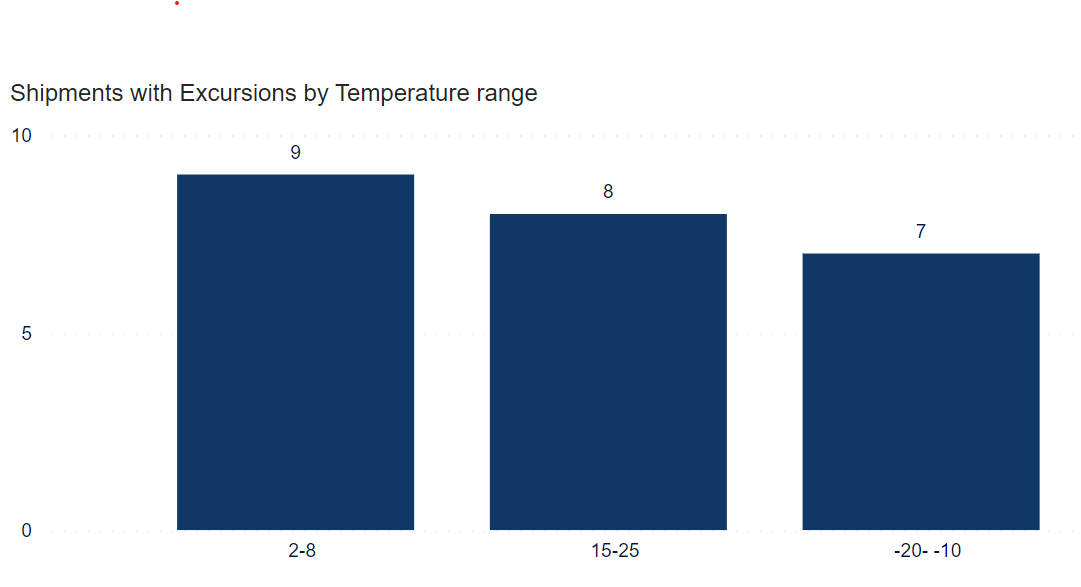 Number of shipments with excursions by temperature range. | To see Excursion ratio by temperature range, in the Temperature range sub-tab, click Excursion ratio. 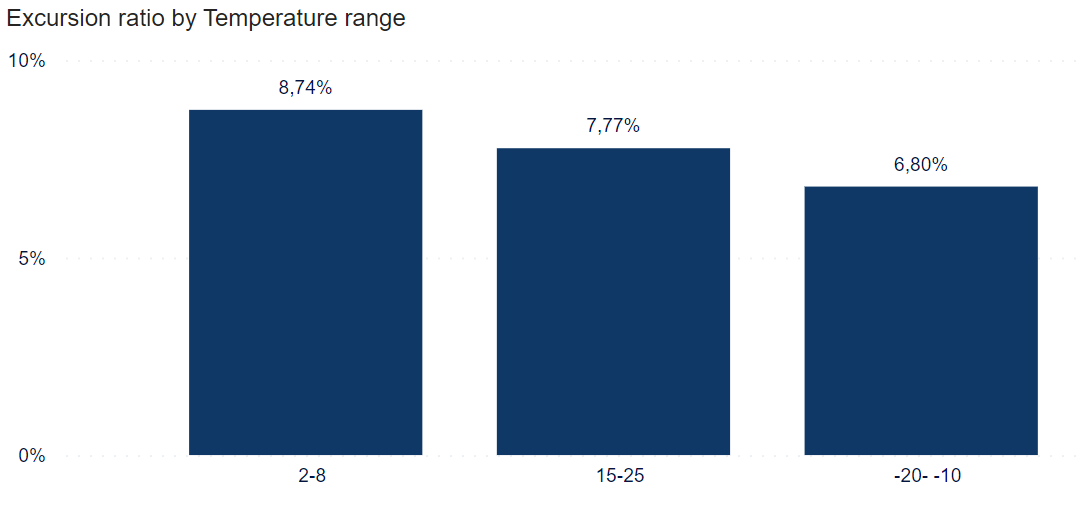 Ratio of shipments with excursions as a percentage of all shipments sorted by temperature range. |
Temperature range (number) | Temperature range (ratio) |
|---|---|
To see Temperature range (number), in the Temperature range sub-tab, click Shipments with excursions. 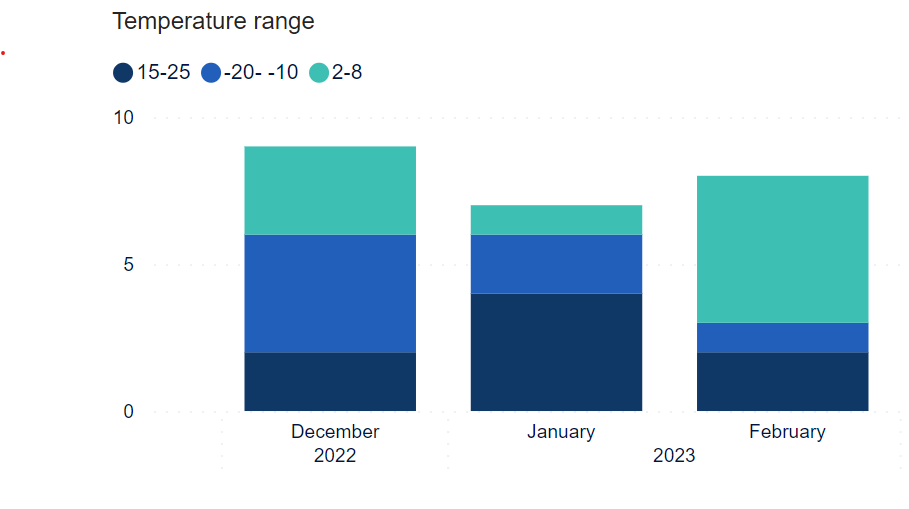 Number of shipments with excursions by temperature range configured for the shipment. | To see Temperature range (ratio), in the Temperature range sub-tab, click Excursion ratio. 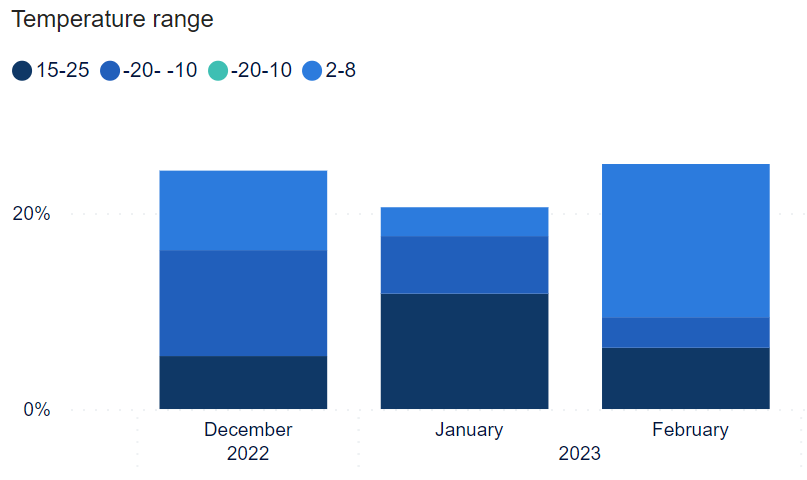 Ratio of shipments with excursions as a percentage of all shipments sorted by temperature range configured for the shipment. |
Shipments with excursions by lane and severity | Excursion ratio by by lane and severity |
|---|---|
To see Shipments with excursions by lane and severity, in the sub-tab, click Shipments with excursions. Number of shipments with excursions by lane and severity. | To see Excursion ratio by lane and severity, in the sub-tab, click Excursion ratio. Ratio of shipments with excursions by lane and severity. |
Severity level. One of the following:
Low
Medium
High
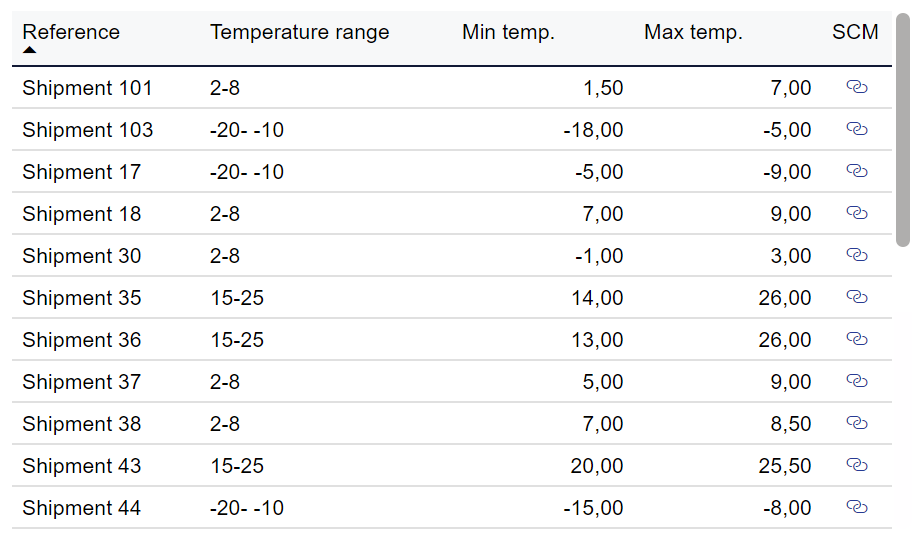
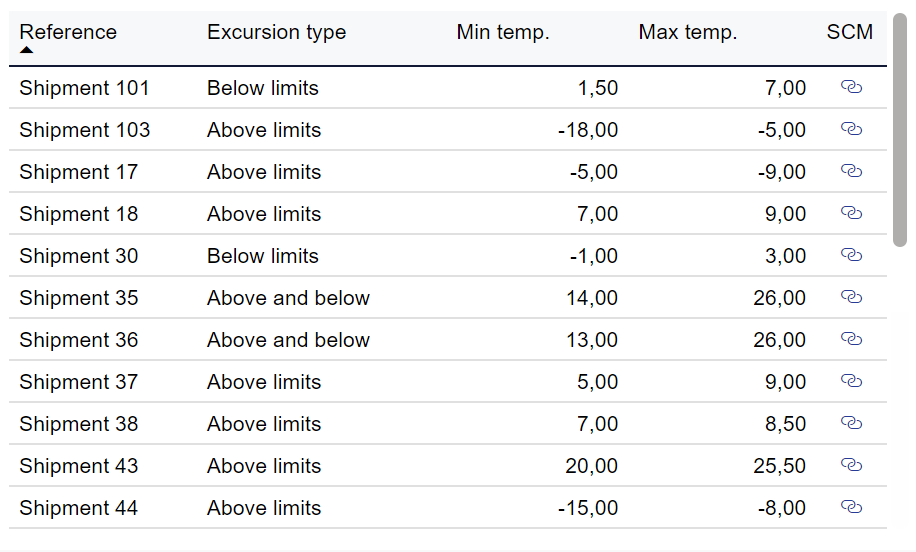
Details about shipments that have had temperature excursions.
Item | Description |
|---|---|
Reference | Reference to unique identifier of shipment in customer's system. |
Temperature range | Temperature range set for this shipment. |
Min temp. | Minimum temperature logged for shipment. |
Max temp. | Maximum temperature logged for shipment. |
SCM | Link to shipment in Controlant Platform (SCM). |
This section of the report contains details about the time it took for the first excursion to occur in shipments.
Tip
You can choose between graphs showing the number of shipments with each type of excursion, or the ratio of shipments with each type of excursion out of all shipments.
Shipments with excursions by time to first excursion | Excursion ratio by time to first excursion |
|---|---|
To see Shipments with excursions by time to first excursion, in the Time to first excursion sub-tab, click Shipments with excursions.  Number of shipments with excursions by time to first excursion. | To see Excursion ratio by time to first excursion, in the Time to first excursion range sub-tab, click Excursion ratio. 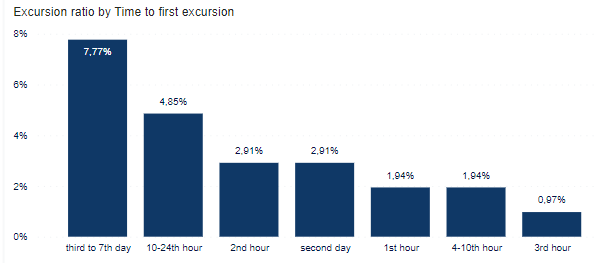 Ratio of shipments with excursions by time to first excursion. |
Time to first excursion grouping:
Shipments with excursions by time to first excursion | Excursion ratio by time to first excursion |
|---|---|
To see Shipments with excursions by time to first excursion, in the Time to first excursion sub-tab, click Shipments with excursions. 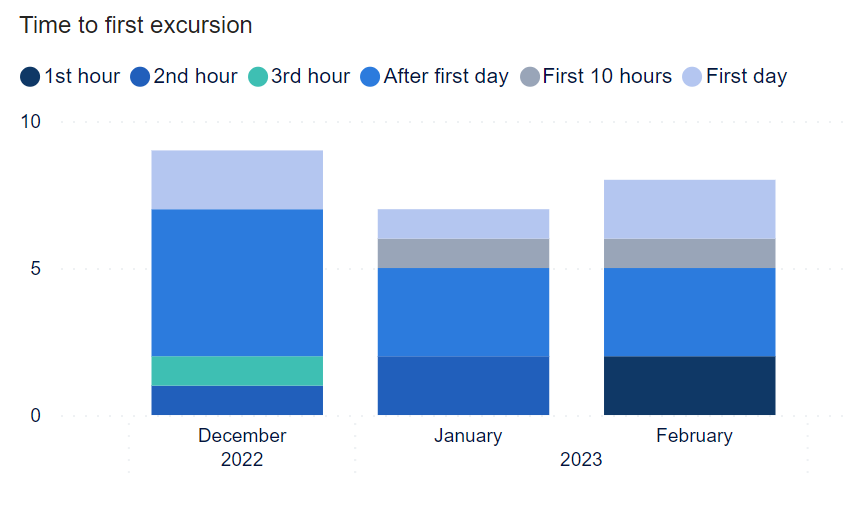 Number of shipments by month and time to first excursion. | To see Excursion ratio by time to first excursion, in the Time to first excursion range sub-tab, click Excursion ratio. 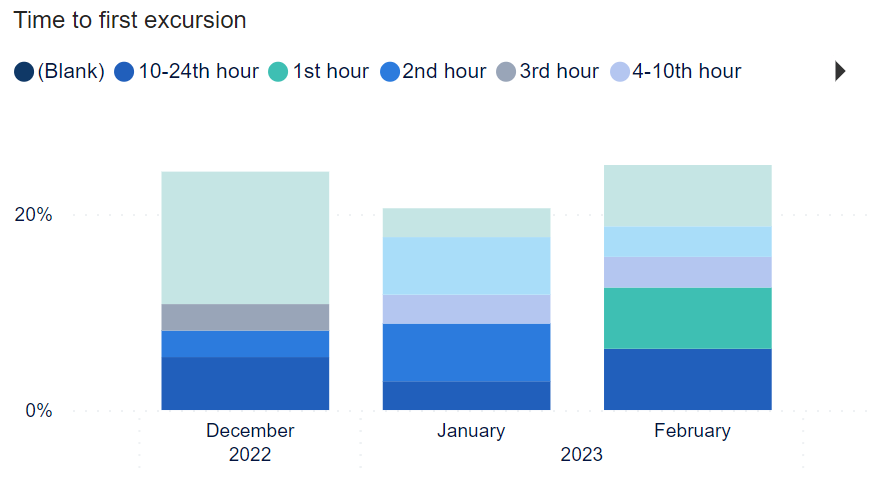 Ratio of shipments by month and time to first excursion. |
Time to first excursion grouping:
Shipments with excursions by lane and severity | Excursion ratio by by lane and severity |
|---|---|
To see Shipments with excursions by lane and severity, in the sub-tab, click Shipments with excursions. Number of shipments with excursions by lane and severity. | To see Excursion ratio by lane and severity, in the sub-tab, click Excursion ratio. Ratio of shipments with excursions by lane and severity. |
Severity level. One of the following:
Low
Medium
High
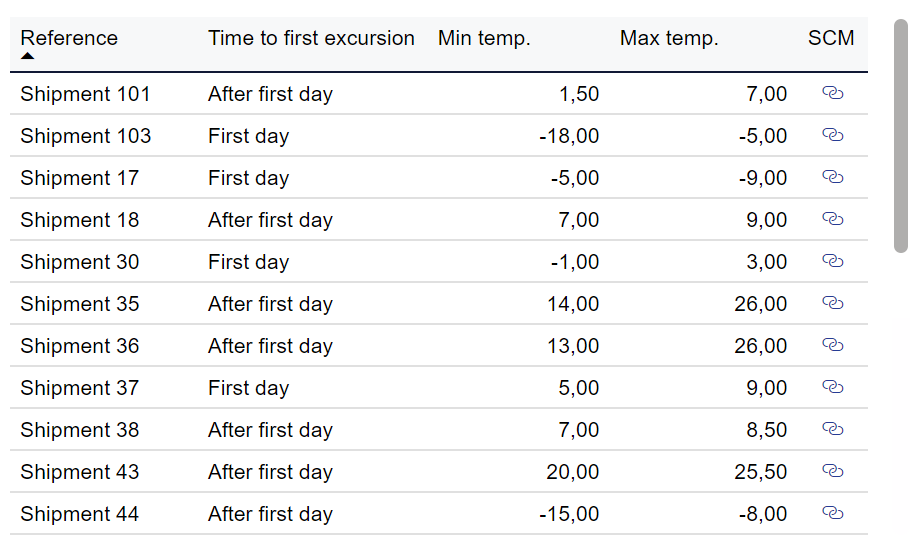
Details about selected shipments that have had temperature excursions.
Item | Description |
|---|---|
Reference | Reference to unique identifier of shipment in customer's system. |
Time to first excursion | Time to first excursion: |
Min temp. | Minimum temperature logged for shipment. |
Max temp. | Maximum temperature logged for shipment. |
SCM | Link to shipment in Controlant Platform (SCM). |
This section of the report contains details about how far into the duration of selected shipments excursions occurred.
Tip
You can choose between graphs showing the number of shipments with each type of excursion, or the ratio of shipments with each type of excursion out of all shipments.
Shipments with excursions by first excursion at % of route | Excursion ratio by first excursion at % of route |
|---|---|
To see Shipments with excursions by first excursion at % of route, in the First excursion at % of route sub-tab, click Shipments with Excursions. 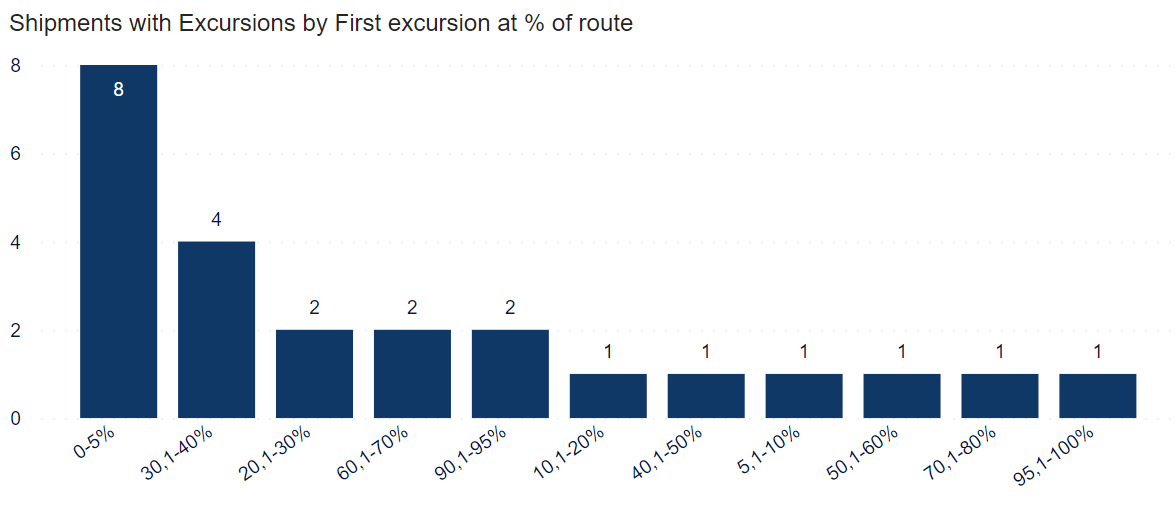 Number of shipments with excursions, grouped by the percentage of route at which first excursion of the shipment occurred. | To see Excursion ratio by first excursion at % of route, in the First excursion at % of route sub-tab, click Excursion ratio. Ratio of shipments with excursions, grouped by the percentage of route at which first excursion of the shipment occurred. |
Shipments with excursions by first excursion at % of route | Excursion ratio by first excursion at % of route |
|---|---|
To see Shipments with excursions by first excursion at % of route, in the First excursion at % of route sub-tab, click Shipments with Excursions. 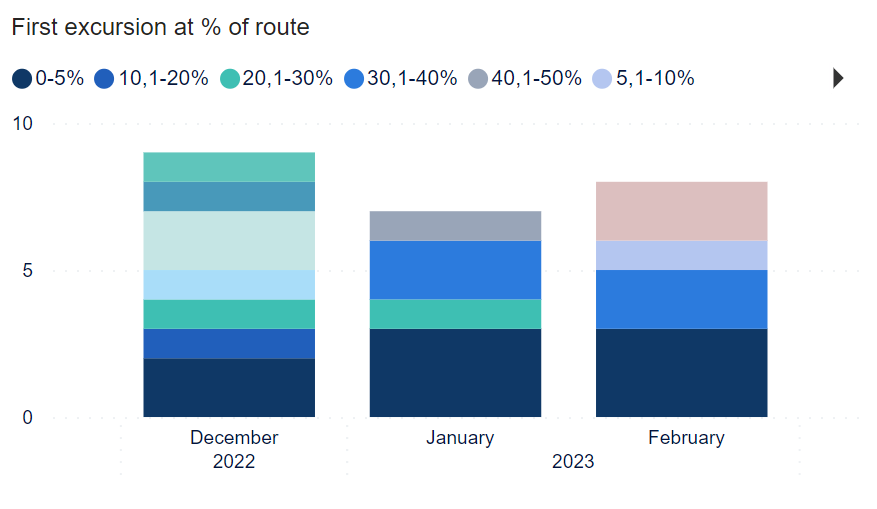 Number of shipments with excursions, grouped by month and the percentage of route at which first excursion of the shipment occurred. | To see Excursion ratio by first excursion at % of route, in the First excursion at % of route sub-tab, click Excursion ratio. 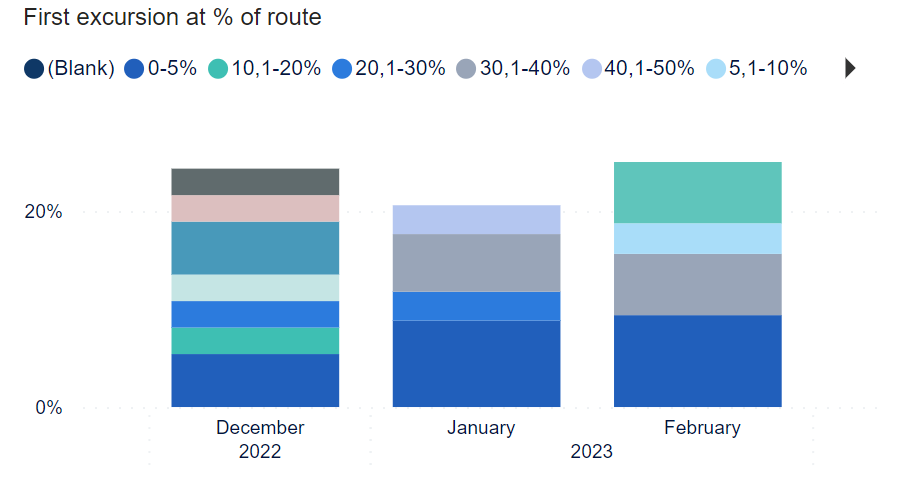 Ratio of shipments with excursions, grouped by month and the percentage of route at which first excursion of the shipment occurred. |
Shipments with excursions by lane and severity | Excursion ratio by by lane and severity |
|---|---|
To see Shipments with excursions by lane and severity, in the sub-tab, click Shipments with excursions. Number of shipments with excursions by lane and severity. | To see Excursion ratio by lane and severity, in the sub-tab, click Excursion ratio. Ratio of shipments with excursions by lane and severity. |
Severity level. One of the following:
Low
Medium
High
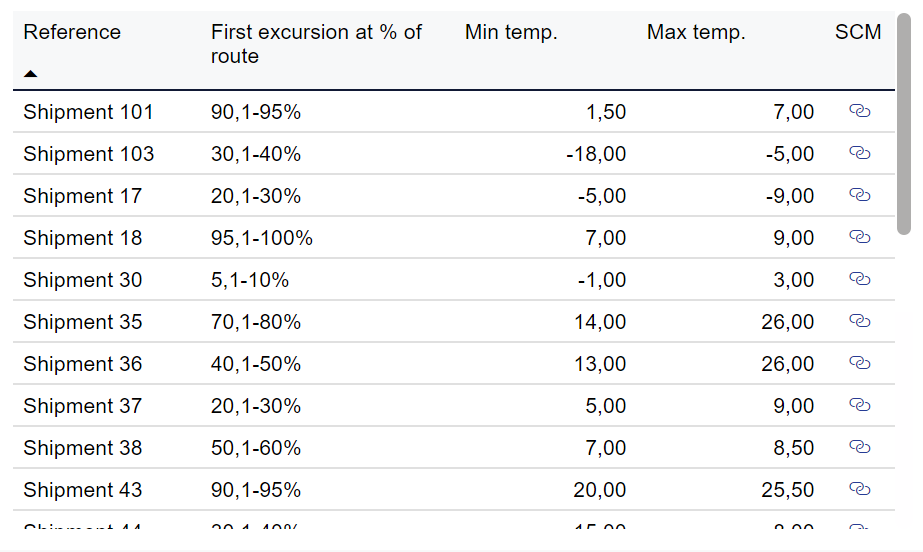
Details about shipments and the percentage of route at which first excursion of the shipment occurred.
Item | Description |
|---|---|
Reference | Reference to unique identifier of shipment in customer's system. |
First excursion at % of route | Percentage of route at which first excursion of the shipment occurred. |
Min temp. | Minimum temperature logged for shipment. |
Max temp. | Maximum temperature logged for shipment. |
SCM | Link to shipment in Controlant Platform (SCM). |
This section of the report contains details about excursions by carrier.
Tip
You can choose between graphs showing the number of shipments with each type of excursion, or the ratio of shipments with each type of excursion out of all shipments.
Shipments with Excursions by Carrier | Excursion ratio by Carrier |
|---|---|
To see Shipments with Excursions by Carrier, in the Carrier sub-tab, click Shipments with Excursions. 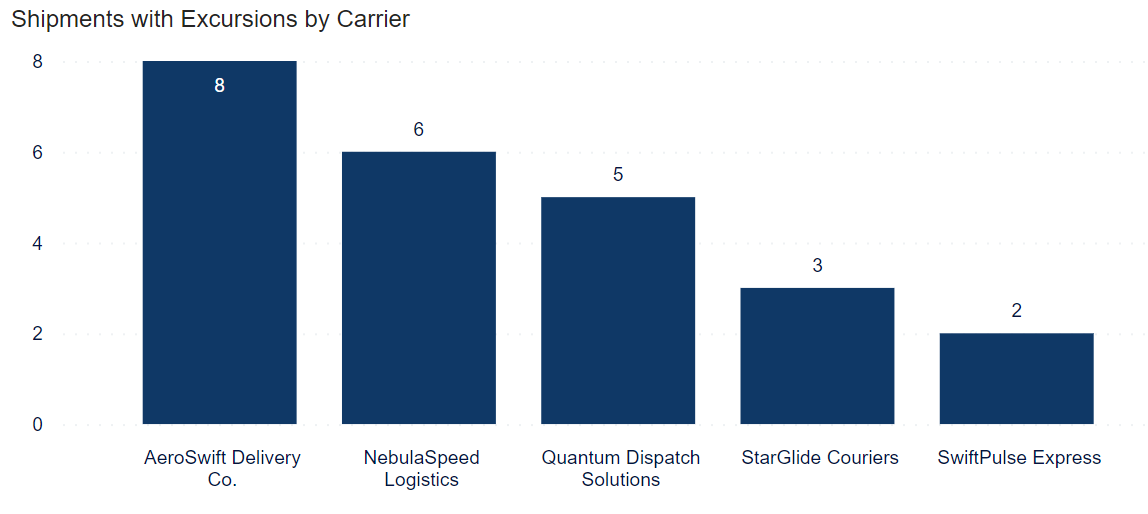 Number of shipments with excursions, grouped by carrier. | To see Excursion ratio by Carrier, in the Carrier sub-tab, click Excursion ratio. 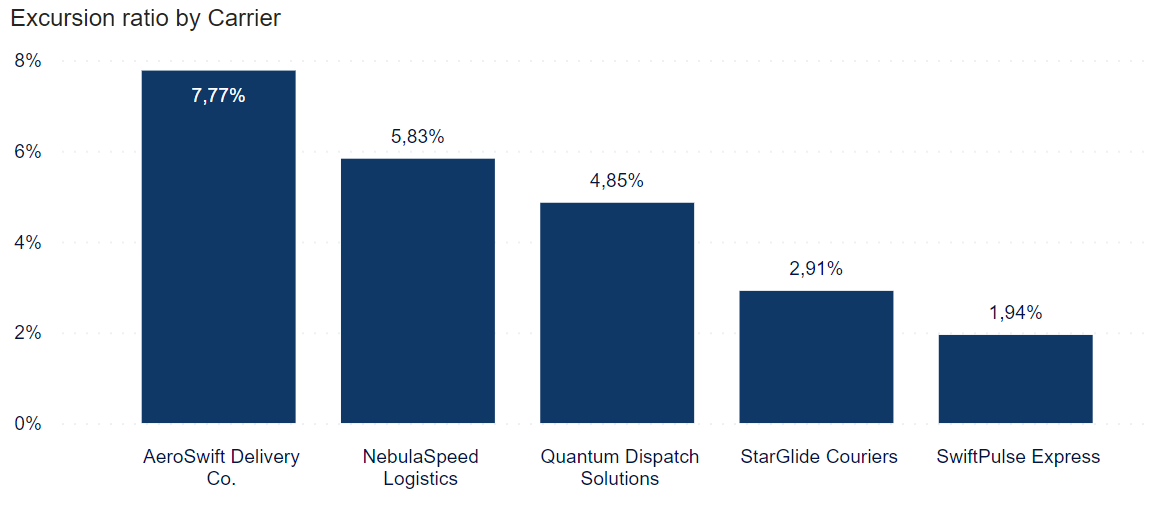 Ratio of shipments with excursions, grouped by carrier. |
Carrier (number of excursions) | Carrier (ratio of excursions) |
|---|---|
To see Carrier (number of excursions), in the Carrier sub-tab, click Shipments with Excursions. 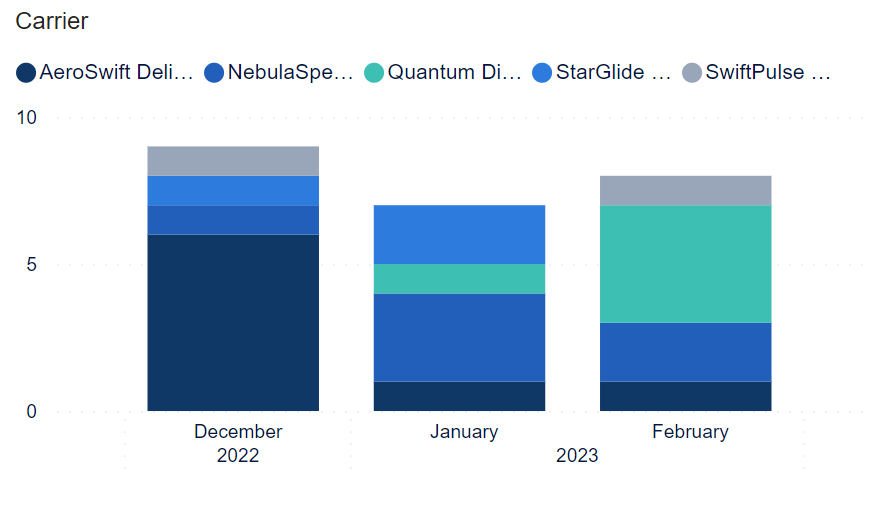 Number of shipments with excursions, grouped by month and carrier. | To see Carrier, in the Carrier sub-tab, click Excursion ratio. 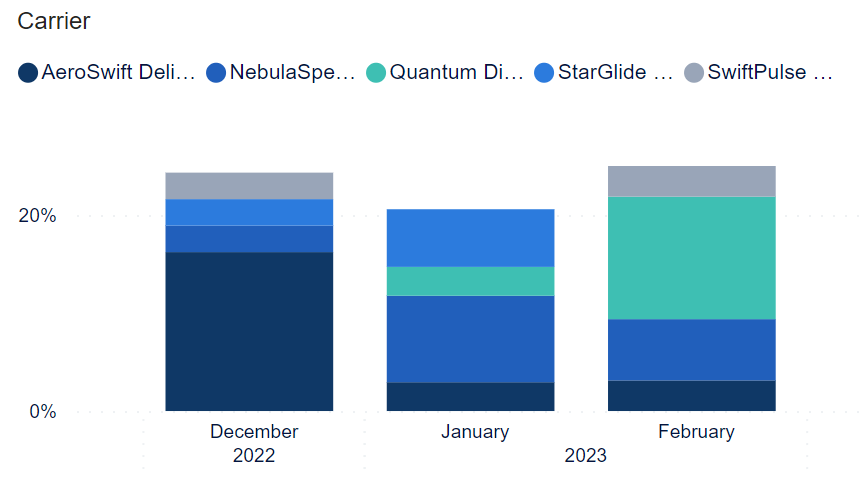 Ratio of shipments with excursions, grouped by month and carrier. |
Shipments with excursions by lane and severity | Excursion ratio by by lane and severity |
|---|---|
To see Shipments with excursions by lane and severity, in the sub-tab, click Shipments with excursions. Number of shipments with excursions by lane and severity. | To see Excursion ratio by lane and severity, in the sub-tab, click Excursion ratio. Ratio of shipments with excursions by lane and severity. |
Severity level. One of the following:
Low
Medium
High
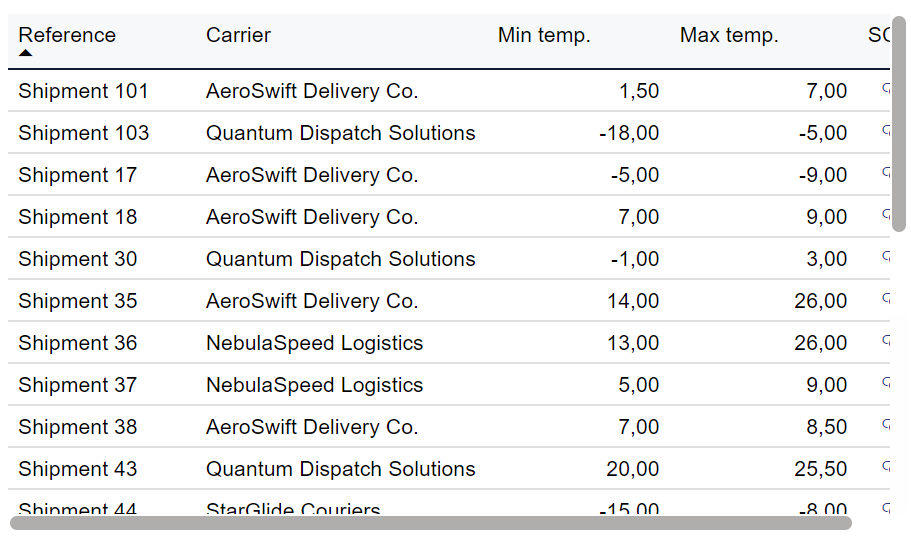
Details about shipments with excursions and the carrier of the shipment.
Item | Description |
|---|---|
Reference | Reference to unique identifier of shipment in customer's system. |
Carrier | Carrier of shipment. |
Min temp. | Minimum temperature logged for shipment. |
Max temp. | Maximum temperature logged for shipment. |
SCM | Link to shipment in Controlant Platform (SCM). |
This section of the report contains details about excursions by mode of transportation used in the shipment.
Tip
You can choose between graphs showing the number of shipments with each type of excursion, or the ratio of shipments with each type of excursion out of all shipments.
Shipments with excursions by transportation mode | Excursion ratio by transportation mode |
|---|---|
To see Shipments with excursions by transportation mode, in the Transportation mode sub-tab, click Shipments with excursions. 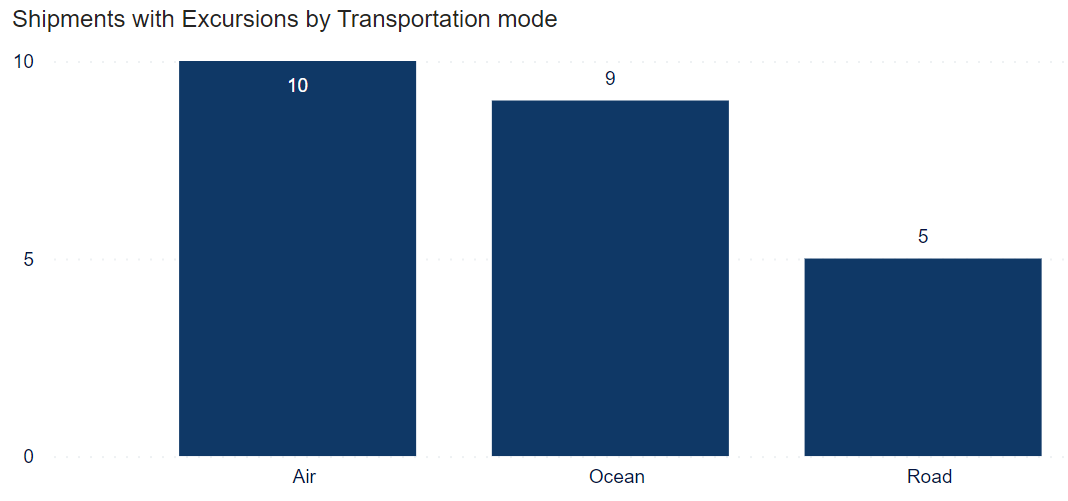 Number of shipments with excursions, grouped by mode of transportation. | To see Excursion ratio by transportation mode, in the Transportation mode sub-tab, click Excursion ratio. 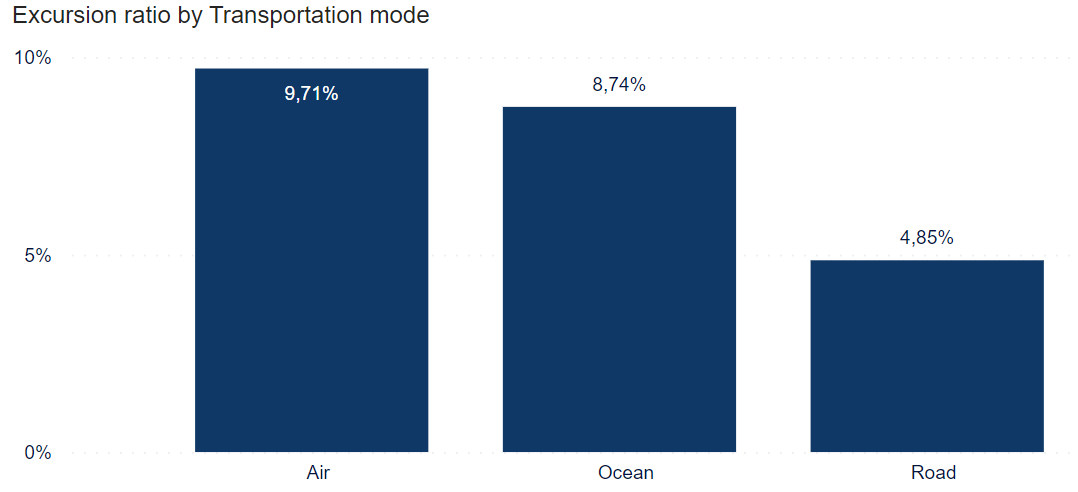 Ratio of shipments with excursions, grouped by month and mode of transportation. |
Mode of transport of shipment:
Air
Ocean
Road
Transportation mode (number of excursions) | Transportation mode (ratio of excursions) |
|---|---|
To see Transportation mode (number of excursions), in the Transportation mode sub-tab, click Shipments with excursions. 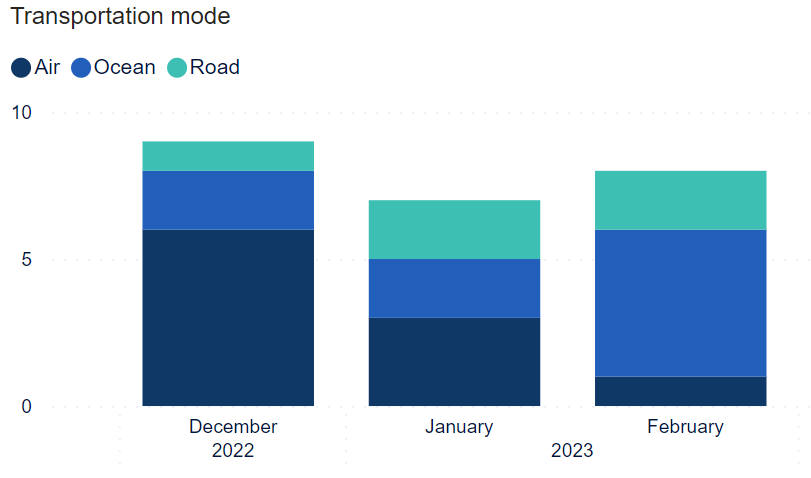 Number of shipments with excursions, grouped by month and mode of transportation. | To see Transportation mode, in the Transportation mode sub-tab, click Excursion ratio. 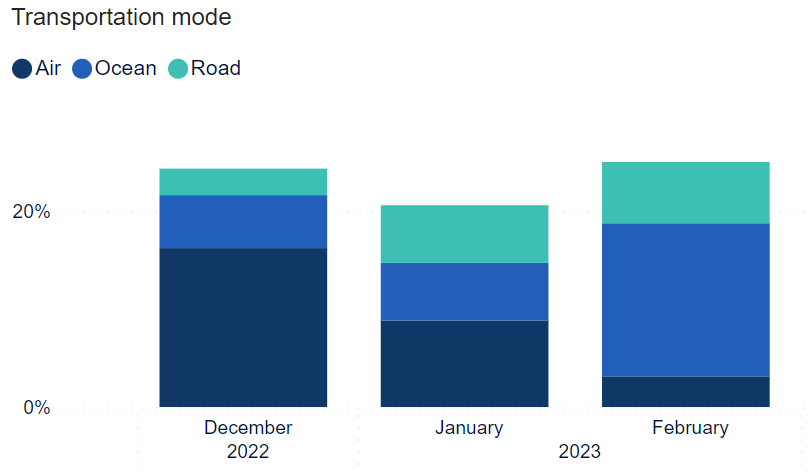 Ratio of shipments with excursions, grouped by month and mode of transportation. |
Shipments with excursions by lane and severity | Excursion ratio by by lane and severity |
|---|---|
To see Shipments with excursions by lane and severity, in the sub-tab, click Shipments with excursions. Number of shipments with excursions by lane and severity. | To see Excursion ratio by lane and severity, in the sub-tab, click Excursion ratio. Ratio of shipments with excursions by lane and severity. |
Severity level. One of the following:
Low
Medium
High
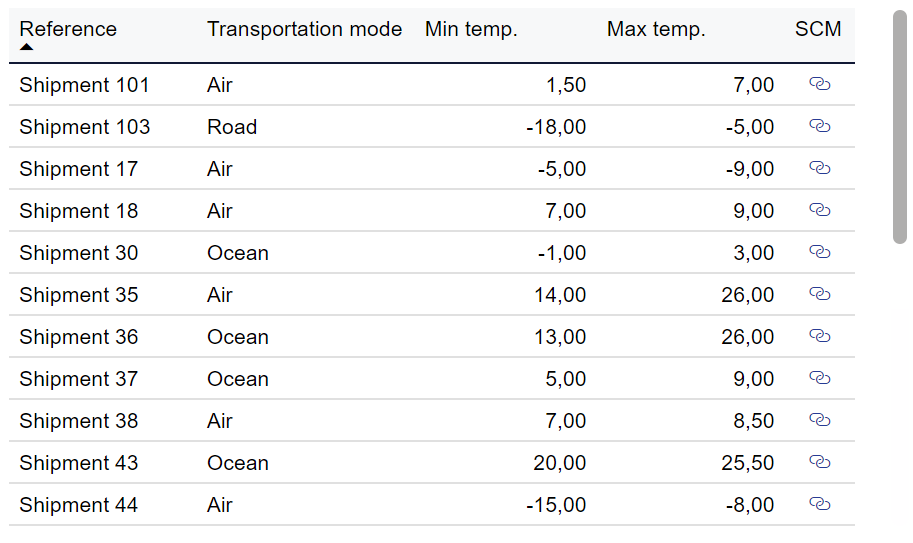
Details about shipments with excursions and their mode of transport.
Item | Description |
|---|---|
Reference | Reference to unique identifier of shipment in customer's system. |
Transportation mode | Mode of transportation of shipment. Options can be added by customer, but typically include:
|
Min temp. | Minimum temperature logged for shipment. |
Max temp. | Maximum temperature logged for shipment. |
SCM | Link to shipment in Controlant Platform (SCM). |