Shipments overview
Release notes for Controlant Analytics - Shipments overview.
Shipments overview v.2.3.x
Solution/product | Controlant Analytics - Shipments overview |
Version | 2.3.2 |
Type of release | Minor |
Live release date | 28 April 2026 |
Improvements and bug fixes
Added shipment_id to the Shipment page table in table columns (multiple slicer).
Fixed an issue with temperature range counting.
Customer impact: Low
Solution/product | Controlant Analytics - Shipments overview |
Version | 2.3.1 |
Type of release | Minor |
Live release date | 26 March 2026 |
Bug fix
Corrected an issue affecting the filter functionality on the MARS ticket page.
Customer impact: Low
Solution/product | Controlant Analytics - Shipments overview |
Version | 2.3.0 |
Type of release | Minor |
Live release date | 19 March 2026 |
Improvements
Filtering on the Temperature page has been improved to provide more consistent and reliable results when narrowing down datasets.
The front page summary now shows an aggregated overview across all available data, instead of dynamically changing based on filters applied on subpages.
The start date for reports has been standardised to January 1, 2024.This ensures consistent historical coverage across reports and avoids confusion caused by varying start dates.
Bug fixes
Fixed an issue where excursion aggregation counts and logger counts could be incorrect under specific conditions.This improves data accuracy and reliability in reporting and analysis.
Resolved a bug that caused an incorrect count of MARS tickets for MARS customers.The displayed ticket counts now accurately reflect the underlying data.
Customer impact: Low
Solution/product | Controlant Analytics - Shipments overview |
Version | 2.2 |
Type of release | Minor |
Live release date | 24 November 2023 |
This new release contains multiple minor improvements, such as additional filters, columns and slicers for visuals.
New features
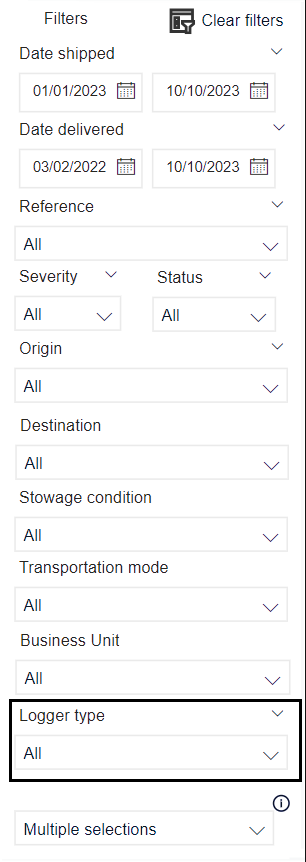
Filters
You can now filter by type of logger.
Shipments tab
In the Shipments tab KPIs you can now see the ratio of shipments delivered vs. closed.

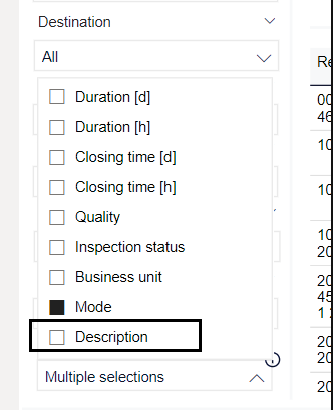
In the Shipments tab, in the Details about all shipments table, you can now add the description field. The description field contains an optional description you can add when creating a shipment.
Temperature tab
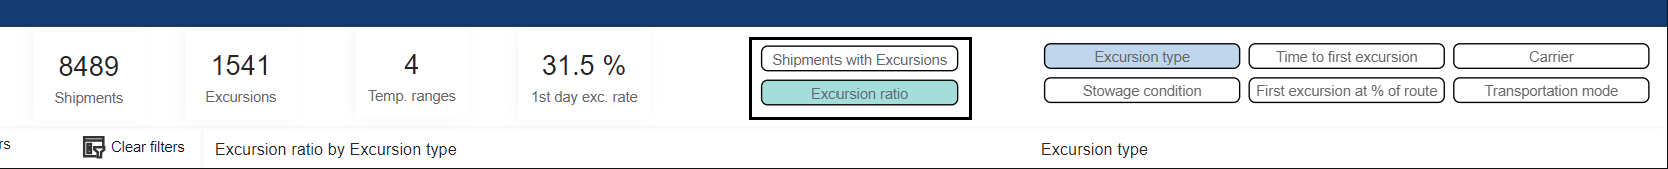
It can be helpful to see the ratio of shipments that have had excursions, especially when you want to monitor changes over time.
In the Temperature tab, you can now choose between graphs showing:
Absolute number of shipments with excursions.
Ratio of shipments with excursions as a percentage of all shipments.
The time interval of the grouping in time to first excursion graph has been extended beyond the first day. Now it will group results into the following:
1st hour
2nd hour
3rd hour
4-10th hour
10-24th hour
Second day
Third to 7th day
After a week
In the Temperature tab you can now see the the number or ratio of excursions grouped by the carrier of the shipment.
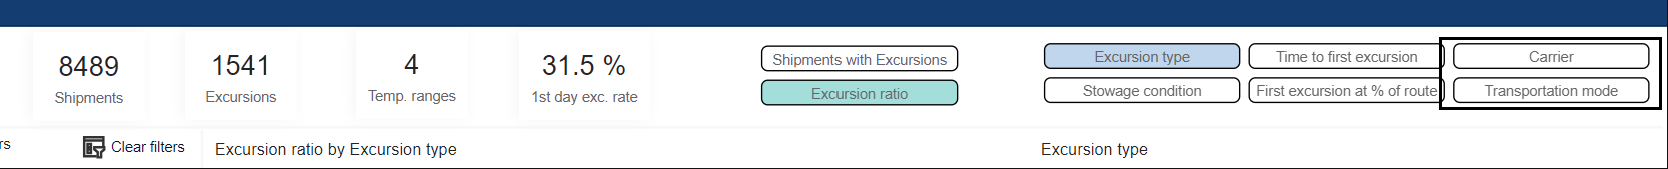
In the Temperature tab you can now see the the number or ratio of excursions grouped by the mode of transportation of the shipment.
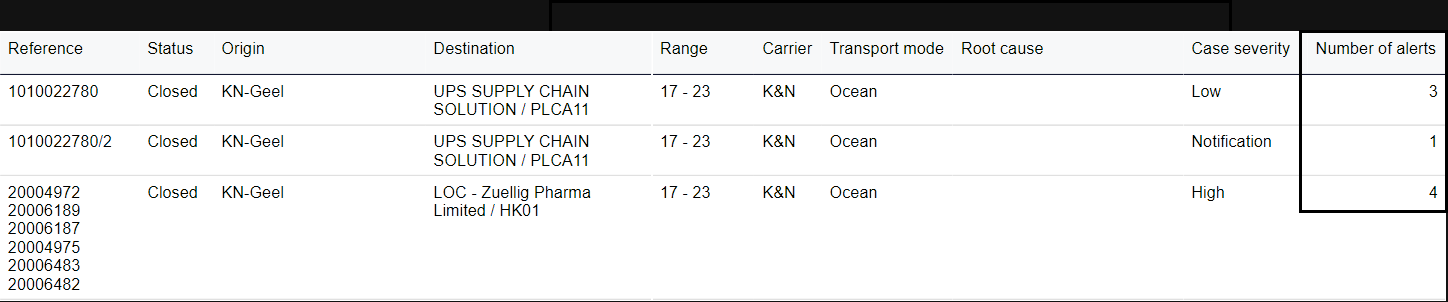
MARS tickets tab
In the MARS overview tab, for each ticket, you can now see the number of alerts and the highest severity alert that have been sent for that ticket.