SCM release notes v2.25.x
Solution | Controlant Platform (SCM) |
Version | 2.25.5 |
Type of release | Patch |
Live release date | 13 July 2023 |
Improvements and bug fixes
Updating various backed services: Improving security and authentication for two backend services.
Solution | Controlant Platform (SCM) |
Version | 2.25.4 |
Type of release | Patch |
Live release date | 7 July 2023 |
Improvements and bug fixes
Bug fix: Correcting Dual Boundaries shipments already delivered from not being able to display boundaries when one of the boundaries is set to 0. The bug prevented SCM UI from displaying boundary information after Shipment Delivery in the Boundaries section of the application.
This was a display issue in the UI only and did not affect the Quality Status functionality nor the ability of the system to send out alarms during an excursion.
Patches: Enhanced logging to analyze performance spikes in Audit Trail Service. Switch logs to Firehose in Audit Trail Service.
Solution | Controlant Platform (SCM) |
Version | 2.25.3 |
Type of release | Patch |
Live release date | 4 July 2023 |
Improvements and bug fixes
Bug fix: Prevent future Dual Boundaries shipments from not being able to display boundaries when one of the boundaries is set to 0. The bug prevented SCM UI from displaying boundary information after Shipment Delivery in the Boundaries section of the application.
This was a display issue in the UI only and did not affect the Quality Status functionality nor the ability of the system to send out alarms during an excursion.
Solution | Controlant Platform (SCM) |
Version | 2.25.2 |
Type of release | Patch |
Live release date | 3 July 2023 |
Improvements and bug fixes
SCM
Fixed min temperature so it highlights correctly in the boundaries table (bug only found in 2.25.0).
Fixed MFA method dropdown so it is not locked when MFA Enabled setting is locked on the customer level.
Account admin
Updating live date on Audit Trail.
Other
Updating various backend services.
Solution | Controlant Platform (SCM) |
Version | 2.25.1 |
Type of release | Patch |
Live release date | 3 July 2023 |
Improvements and bug fixes
Account admin
Adjust the range selector in the new audit trail to align with the go live date to assure that audit trail data is visible only after go-live.
Adjustment of the navigation bar appearance in the Account Admin UI.
Fixed bug to correct incorrect behavior in the Audit Trail date picker when selecting last 7 days.
Fixed bug to stop spaces in the reference field from being replaced with “+” when using the search for the first time in Audit Trail.
SCM
Blocking Quality Status and Excursion type from changing after closing under rare circumstances when a shipment is manually closed on a missing data shipment.
Making sure pdf reports are generated even if a logger is missing all data or if data is missing in the beginning of a shipment (bug only found in 2.25.0, not live).
Blocking read-only API users from being able to deliver loggers through the API.
Clearing checkboxes when a previously armed shipment is reopened (visual and UX only, bug only found in 2.25.0, not live).
Making sure tooltip explaining data pending appears on delivered loggers that have already sent data to the cloud (bug only found in 2.25.0, not live).
Small text improvement when audits with many line item changes are created.
Fixed a bug that prevented readied shipments from being auto shipped at a scheduled time in the future.
Solution | Controlant Platform (SCM) |
Version | 2.25.0 |
Type of release | Minor |
Release announcement date | 27 April 2023 |
UAT release date | 25 May 2023 |
Live release date | 3 July 2023 |
In this release we are introducing our new Audit Trail, launching Delivery Automation, and improving the investigative UX flow of our shipments by exposing the worst-performing logger temperature data in our shipment view. In addition, we are providing better feedback to our users when loggers are missing or pending data in our shipments.
New features
The Audit Trail is part of the system that receives information about changes from other internal systems and stores them as audit records. The new audit trail solution has an updated user interface (UI) that is more user-friendly and helps the user find the audit record they are looking for quicker and more efficiently.
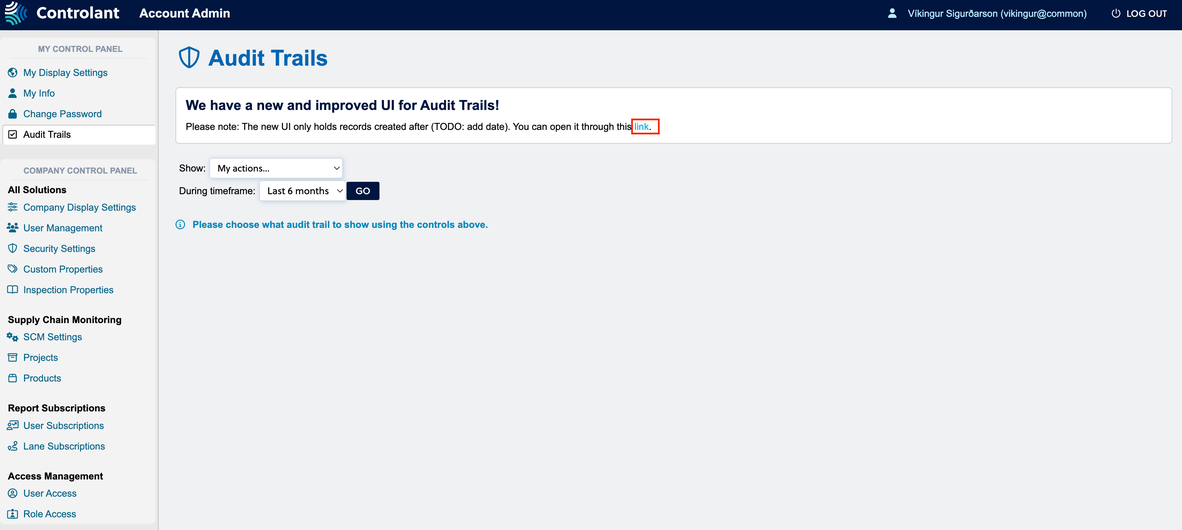
The previous Audit Trail view is still opened directly from the Audit Trails option in the left-side navigation menu of Account Admin. The new UI for Audit Trail is accessible via a link in a banner at the top of the page in the previous Audit Trail UI.
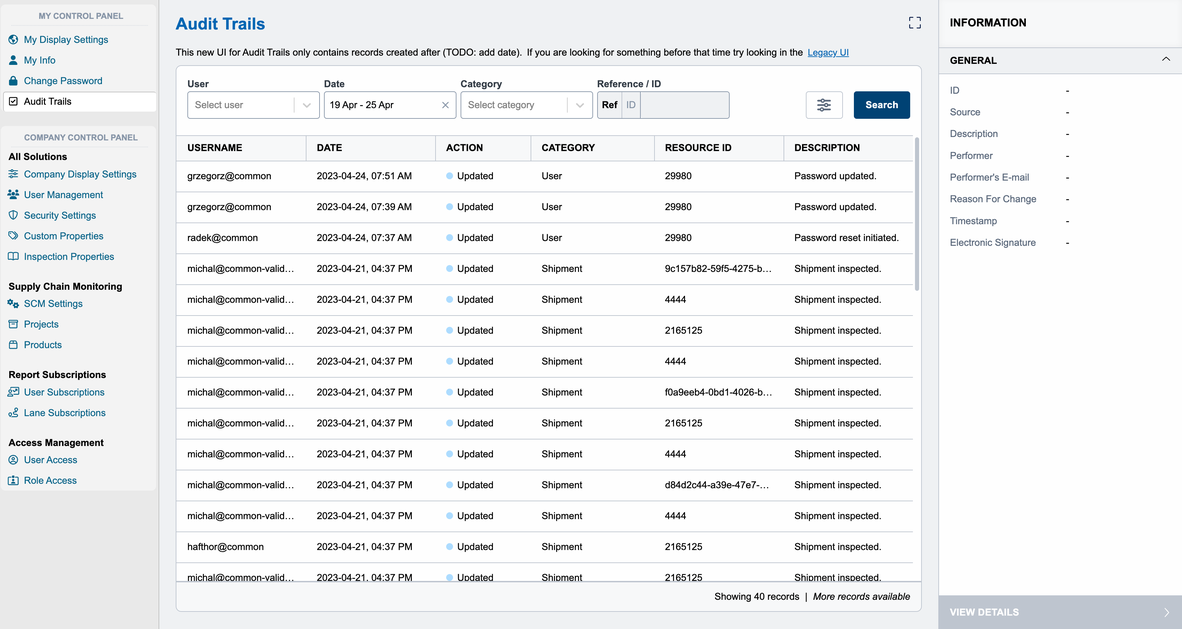
Once opening the new Audit Trail UI for the first time, users are presented with a table of Audit Records that can be filtered by user, date, category, or Reference/ID. There’s an empty information section on the right-hand side that gets populated with information about an audit record. A link above the table filters allows users to navigate back to the previous Audit Trail UI.
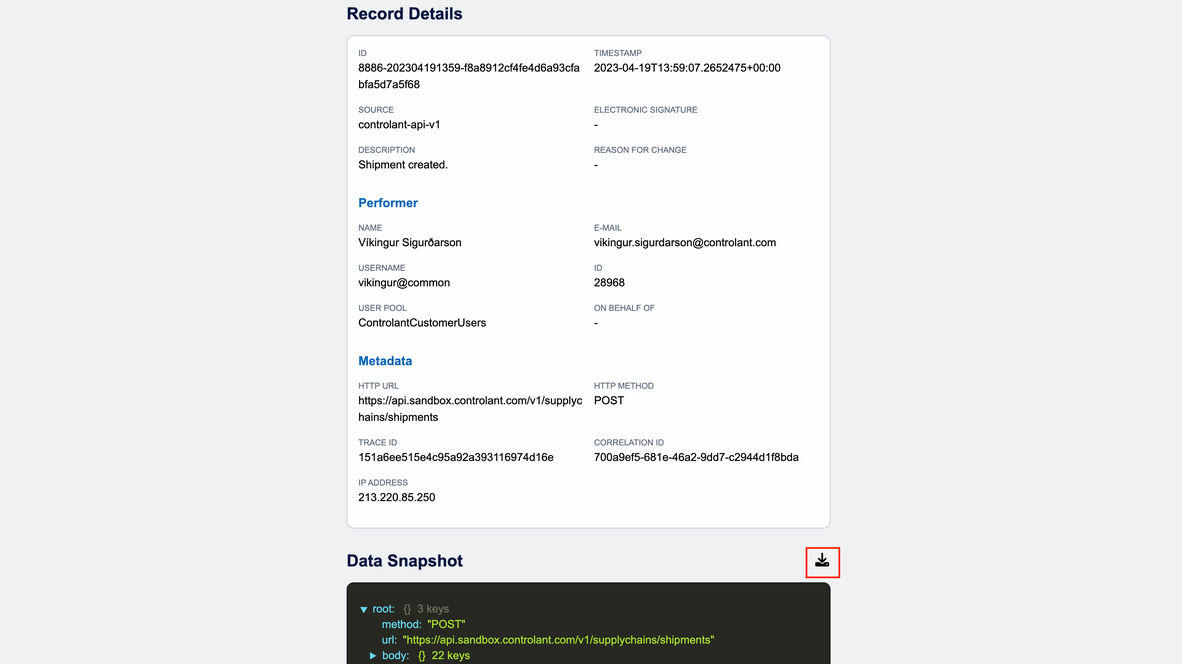
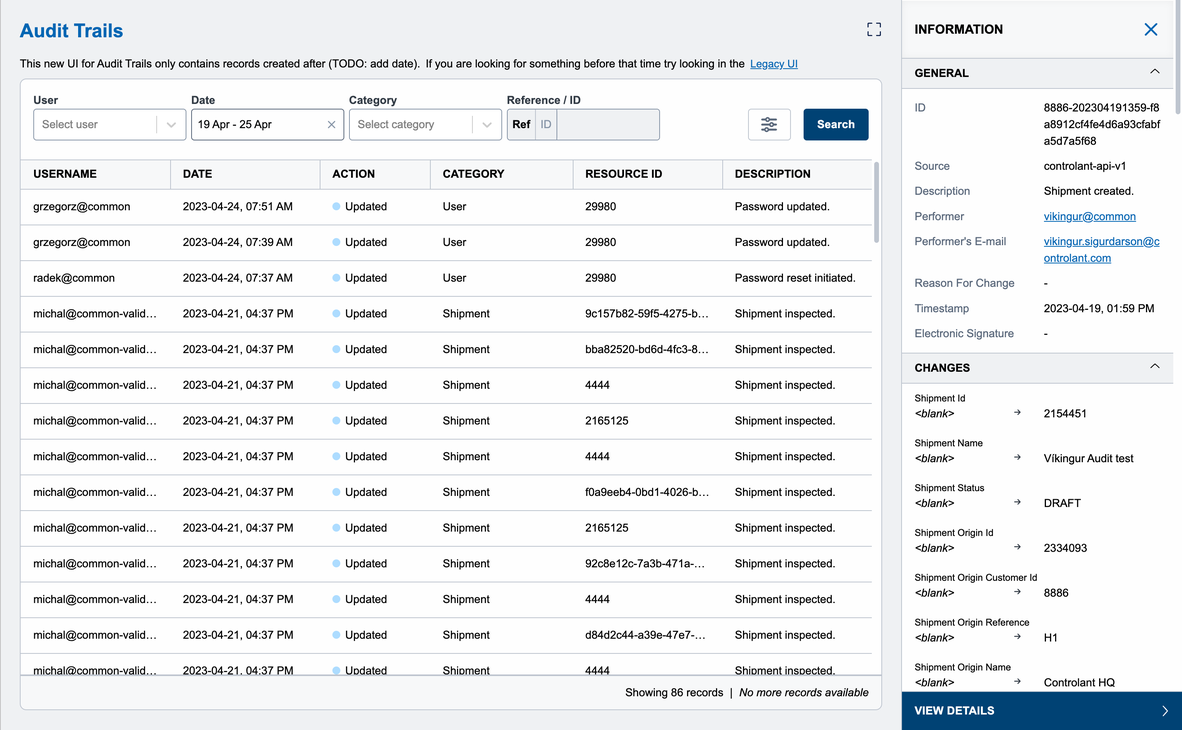
Once an audit record has been selected, the right-side information section gets populated with the relevant data, as can be seen in the picture below. The user can also press “View Details” in the bottom right corner of the screen after selecting an Audit Record from the table. This navigates them to the Record Details screen, where they can see the Metadata, a Data Snapshot, and all of the changes associated with the Audit Record. The Changes are displayed in a 3-column table with the name of the changed value, the original value, and the updated value. The Data Snapshot is a JSON viewer where the request that created the Audit Record can be viewed in its entirety. It is also possible for the user to download the JSON file from the Data Snapshot by clicking the highlighted button from the screenshot below.
AUDRS-1 | Each audit record includes information on the time of the action. |
AUDRS-2 | Each audit record includes information on who made the action. |
AUDRS-3 | Each audit record includes information on the changed value(s) before the change. |
AUDRS-4 | Each audit record includes information on the changed value(s) after the change. |
AUDRS-5 | No user can modify audit records. |
AUDRS-6 | It should be possible to add on behalf of to audit records. |
AUDRS-7 | Audit records should be stored for 10 years |
AUDRS-8 | Audit records are required to have a high-level description indicating what was changed. |
AUDRS-9 | It should be clear if the action being audited was electronically signed. |
AUDRS-11 | It should not be possible to deactivate the Audit Trail for any user actions. |
AUDRS-12 | Audit requests that fail validation are rejected with an error and a message detailing what information is missing or malformed. |
AUDRS-14 | Audit records should be readily available through a UI. |
AUDRS-17 | It should be possible to add a “reason for the change” to audit records. |
SCMRS-589 | An audit trail will be logged when a shipment is shipped manually. |
SCMRS-590 | An audit trail will be logged when a shipment status is updated automatically from Shipping to Delivered. |
SCMRS-591 | An audit trail will be logged when the shipment quality is updated automatically to Good. |
SCMRS-592 | An audit trail will be logged when a shipment product is modified. |
SCMRS-593 | An audit trail will be logged when an SCM report subscription is modified. |
SCMRS-594 | An audit trail will be logged when an internal comment with an attachment is added to a shipment. |
SCMRS-597 | An audit trail will be logged when a user is created. |
SCMRS-598 | An audit trail will be logged when a custom property is added to a shipment. |
SCMRS-599 | An audit trail will be logged when a user manually changes the quality status on a shipment. |
Users will be able to access Audit Records from a new UI.
With this release, we are adding three additional criteria for the automatic delivery of loggers and performing logger delivery as an opt-in feature for customers.
Delivery automation is intended to capture “out-of-flow” scenarios, e.g., when a user doesn’t press the stop button, there is poor connectivity, or manual upload is required. The delivery automation stops the monitoring automatically at the correct time, which leads to the faster generation of the shipment summary report. It also reduces the risk of “false excursion” after the logger has been removed from the shipment.
SCMRS-559 | Only loggers that have the status shipping can be delivered with delivery automation. |
SCMRS-561 | Delivery automation will only deliver loggers based on active stop methods when all criteria have been fulfilled. |
SCMRS-562 | Delivery automation stop methods are ordered based on priority. Delivery automation will select higher-ranked methods if more than one is applicable. |
SCMRS-563 | “Logger at destination event” is applicable for delivery automation. |
SCMRS-564 | By default, a stop button event is applicable if it occurs no more than 6 hours before the logger reported inside the destination geofence and at least one hour after the logger was started. |
SCMRS-567 | By default, a “start button event” is applicable if it occurs no more than 6 hours before the logger reported inside the destination geofence and at least one hour after the logger was started. |
SCMRS-570 | By default, a “data upload event” is applicable if it occurs at least 1 hour after the logger was started. |
SCMRS-572 | Delivery automation will deliver a logger if there is an applicable “data upload event” and an applicable “stop button event.” The delivery timestamp is the same as the “stop button event.” |
SCMRS-573 | Delivery automation will deliver a logger if there is an applicable “data upload event” and an applicable “start button event.” The delivery timestamp is the same as the “start button" event. |
SCMRS-574 | Delivery automation will deliver a logger if there is an applicable “data upload” event and a “logger at destination event”. The delivery timestamp is based on the “logger at destination event.” |
SCMRS-575 | Delivery automation will deliver a logger if there is an applicable data upload event and no other applicable event. The delivery timestamp is based on the data upload event. |
SCMRS-576 | User can see which loggers were delivered with delivery automation and which rule was used to deliver the logger. |
SCMRS-580 | Delivery automation will deliver a logger if the logger has registered a “destination event” and an applicable “stop button event.” The delivery timestamp should be the same as the stop button event. |
SCMRS-581 | Delivery automation will deliver a logger if the logger has registered a “destination event” and an applicable “start button event.” The delivery timestamp should be the same as the “start button event.” |
SCMRS-595 | Delivery automation will deliver a logger if there is an applicable destination event and an applicable light on event. |
We are currently in a soft launch status, utilizing this functionality in a smaller set of shipments before making it available to all our clients. Until the feature is turned on, there is no impact on the user.
The total time out of bounds, Min and Max temperature of a logger was added to the boundaries table. The aim is to improve the user experience (UX) while users are investigating issues with excursions and to make the information found in the pdf reports consistent with the UI.
On a delivered shipment*, when a boundary is expanded, the data for Time out of bounds and Min and Max temperature is shown for each logger. The highest time and highest/lowest temperature are also highlighted to quickly identify the worst-performing loggers.

* Values for Time out of bounds, Min and Max temperature are only available AFTER delivery and data analysis of each shipment. While the shipment is shipping, those values are not shown.

Also worth noting is that the UI design has been updated to better reflect modern patterns and better delineate the data between different boundaries.
Before

After

Important
Notification boundaries will not display this value as we are not currently storing this information because it is not Quality impacting. We will be fixing this in an upcoming patch but want to inform our users to minimize confusion.
This has no impact on the system’s ability to send an alarm if an excursion is triggered or on Quality assessment functionality.
SCMRS-583 | User can see the min and max temperature of a logger in a shipment. |
SCMRS-584 | User can see the total time outside of boundaries for a logger in a shipment. |
Better UX to identify worst breaches of temperature and consistency between UI and the PDF report. The user flow remains the same.
Along with redesigning the boundaries table, the rearm UI has been slightly adjusted as well, following feedback from our heavier users. The rearm checkbox is now next to the boundaries, so that users don't have to expand each row to select the loggers. The rearm all functionality is now a checkbox above all the other checkboxes to better follow standard UI patterns.
Before
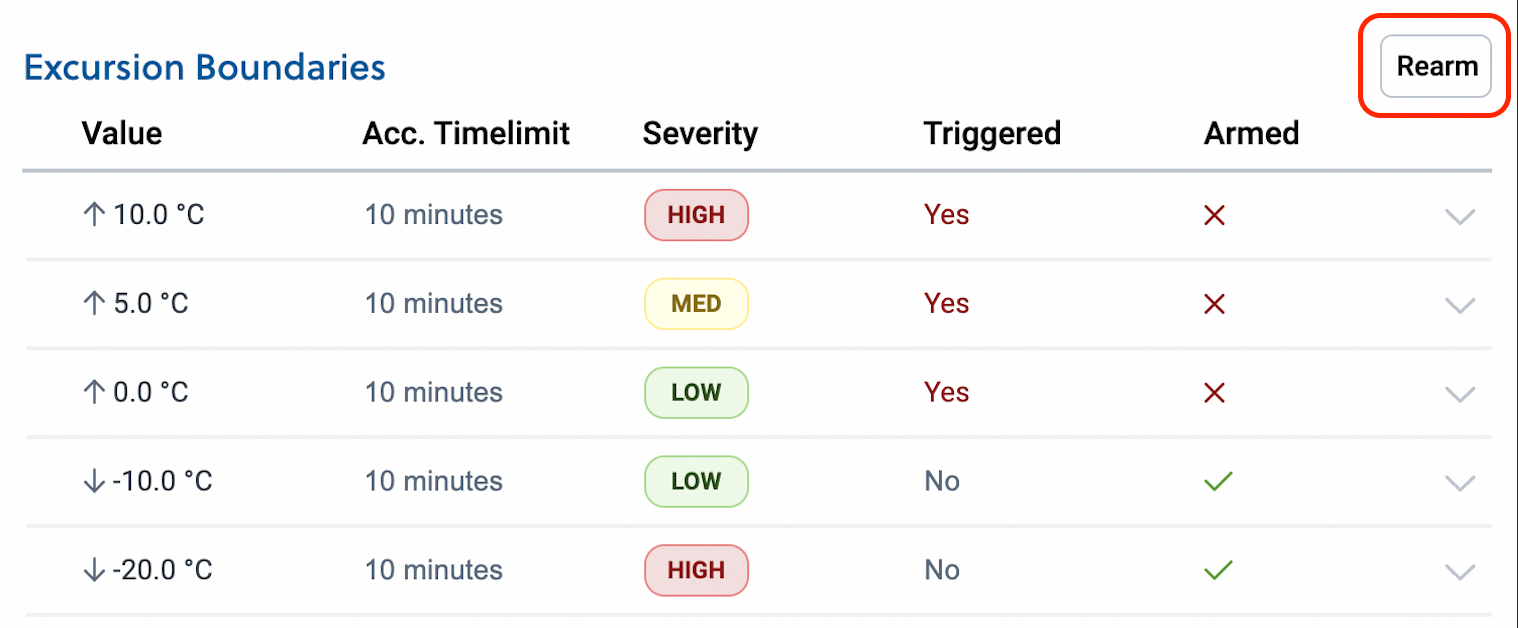
After
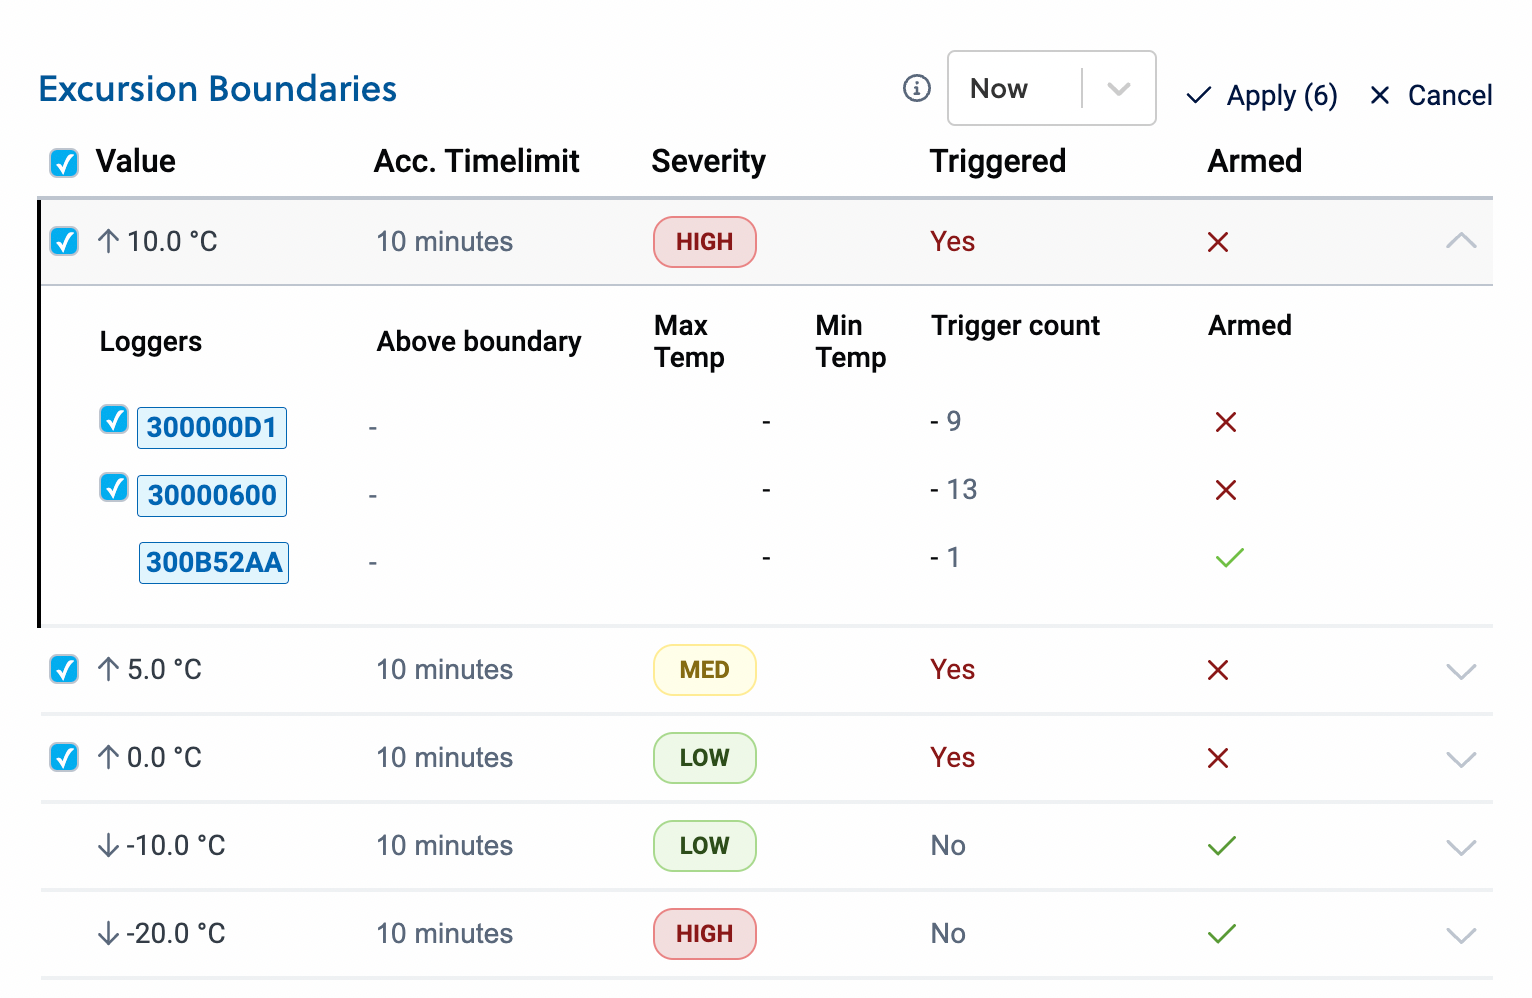
SCMRS-425 | Admin user can rearm loggers that have triggered an alarm. |
One extra click for users trying to Rearm All, one less click for users trying to select specific loggers to rearm.
We have added light and Manual Data Upload events to the logger events list to help our users better investigate shipments on a logger level.
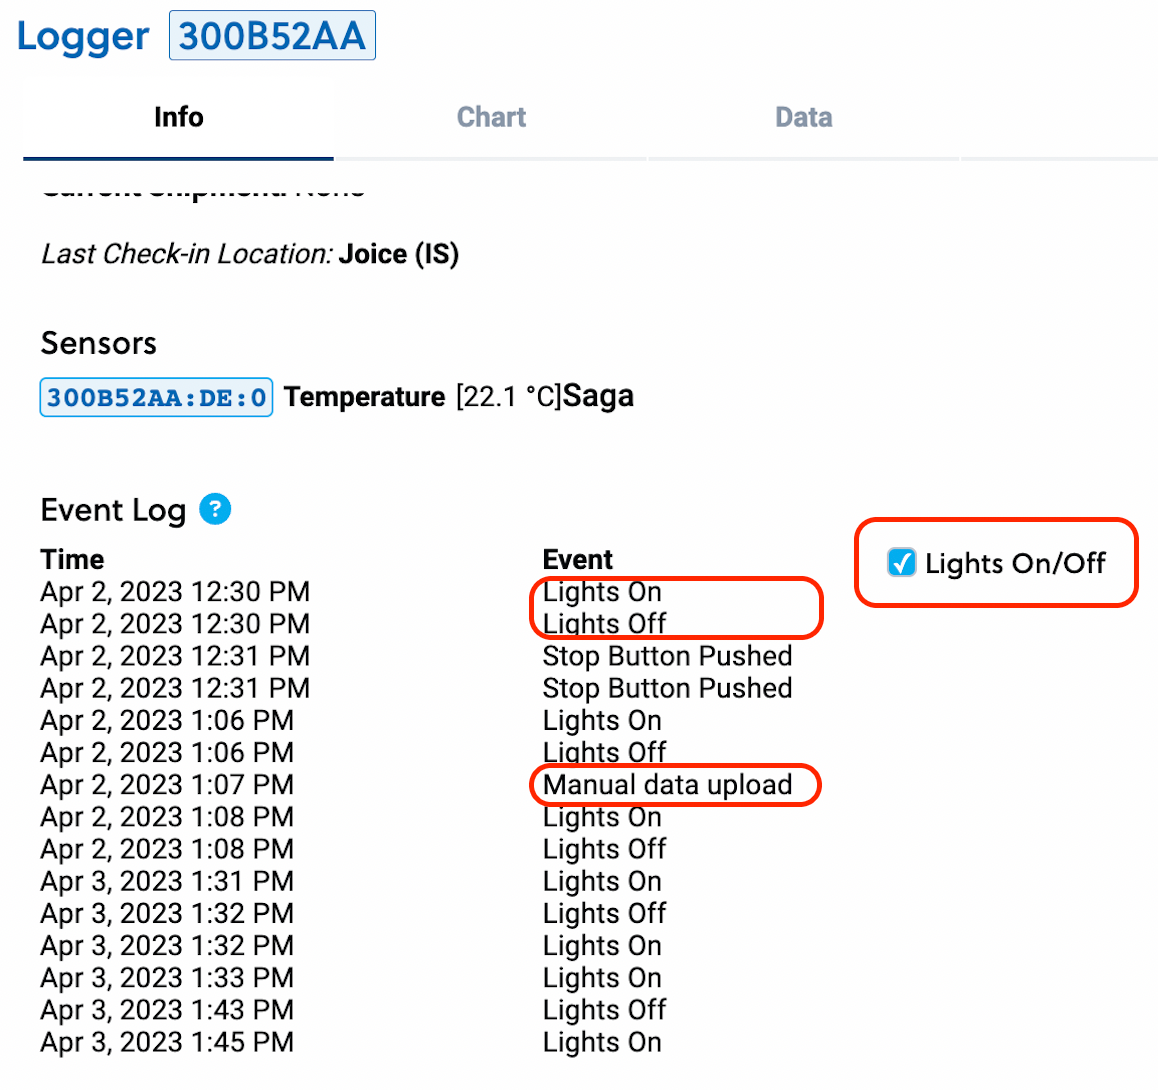
SCMRS-585 | Light events are displayed within Logger events. |
SCMRS-586 | Data upload events are displayed within Logger events |
Improvement when investigating shipments. Any user will be able to go to the logger tab and check if a light or manual data upload event is present within a given time frame.
We have increased the character limit for Inspection Comment to 2000 to give our users more flexibility when inspecting shipments.
Note
This has been updated from the initial announcement that stated 3500 characters to 2000 characters, to ensure better layout for the PDF reports.
SCMRS-587 | Inspection Comment character limit is 3500 characters. |
SCMRS-587 | Inspection Comment character limit is 2000 characters. Updated 24 May 2023: This has been updated from the initial announcement that stated 3500 characters to 2000 characters, to ensure better layout for the PDF reports. |
Users will be able to include more text in the comment. The first page of the PDF report might get pushed to two pages depending on the length of the comment.
We have received feedback regarding missing data and decided to improve the flow by giving users better feedback concerning any issue coming up during shipments. To better describe the term of the status “Missing data” will be changed to “Pending data” and a tooltip will be added to explain the Shipment Analysis Section better.
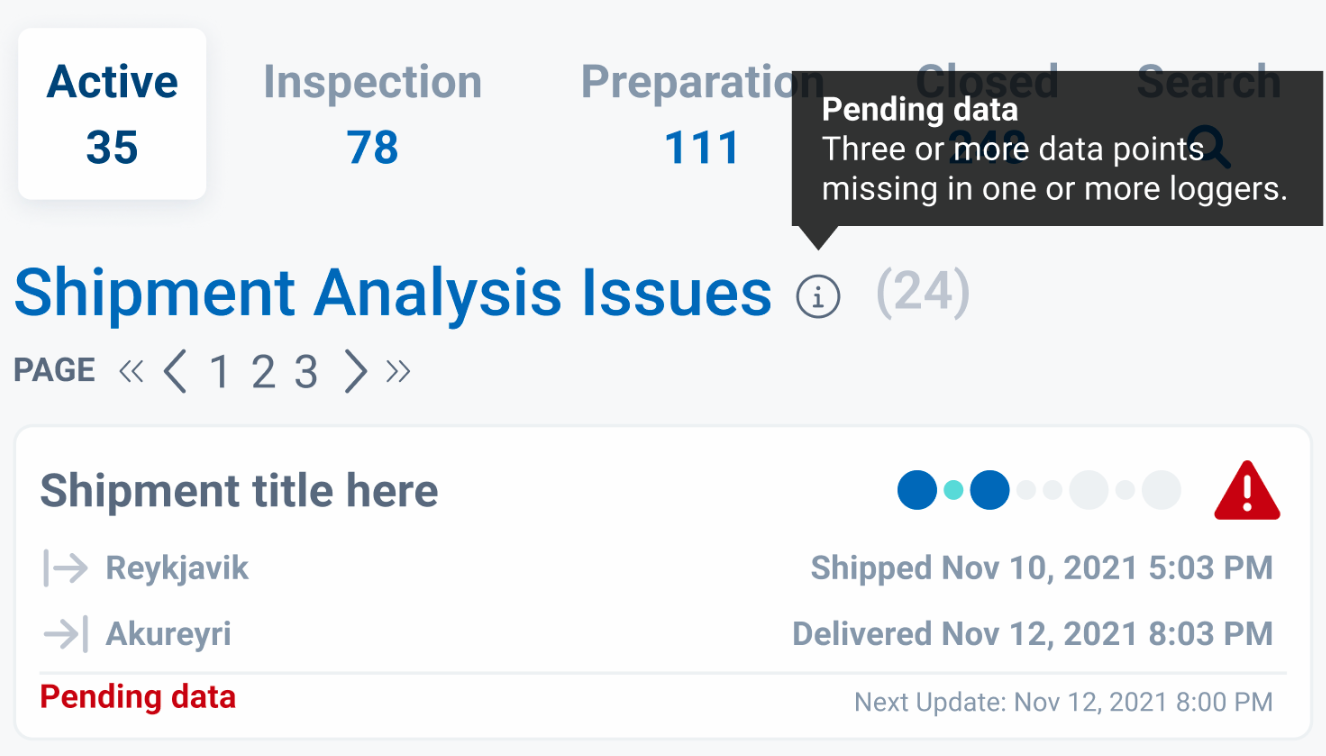
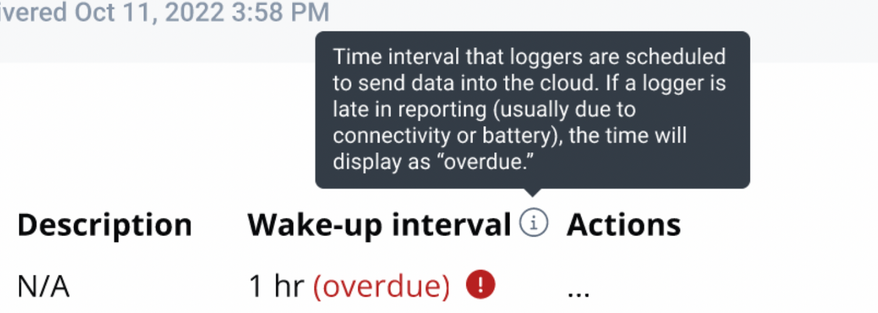
In the Logger section, the next logger wake-up time (when the logger is scheduled to send data) will be displayed to help users know if the pending data is due to normal circumstances or an issue with the logger battery or connectivity that needs manual intervention.
If a wake-up interval goes overdue AND there is missing data, a tooltip will appear to give users more direction on possible fixes.

If a wake-up interview is NOT overdue, but there is missing data on the logger, the user will be given information that this is normal behavior and they should wait.

Note
It is possible that shipping loggers that enter a zone of low connectivity will become overdue in their wake-up. Therefore a tooltip will be added to explain this on the column itself.
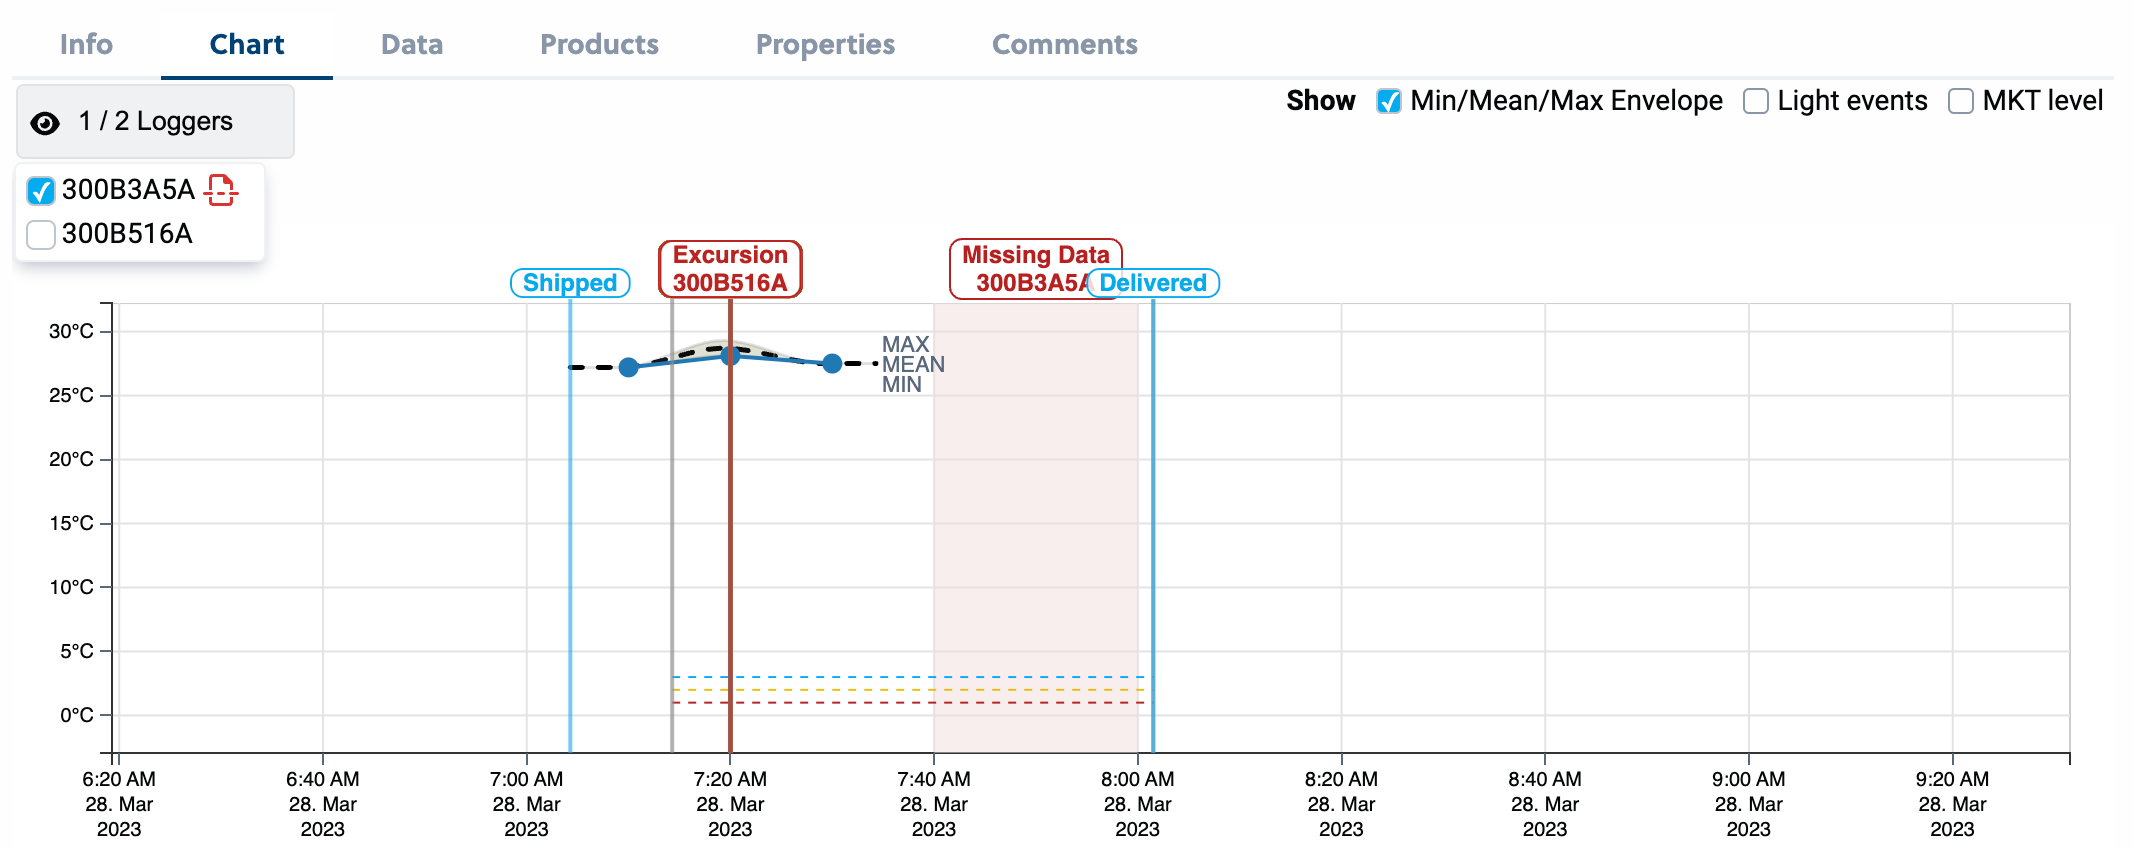
The chart tab will display the periods of missing data as well as mark the problematic loggers in the dropdown.
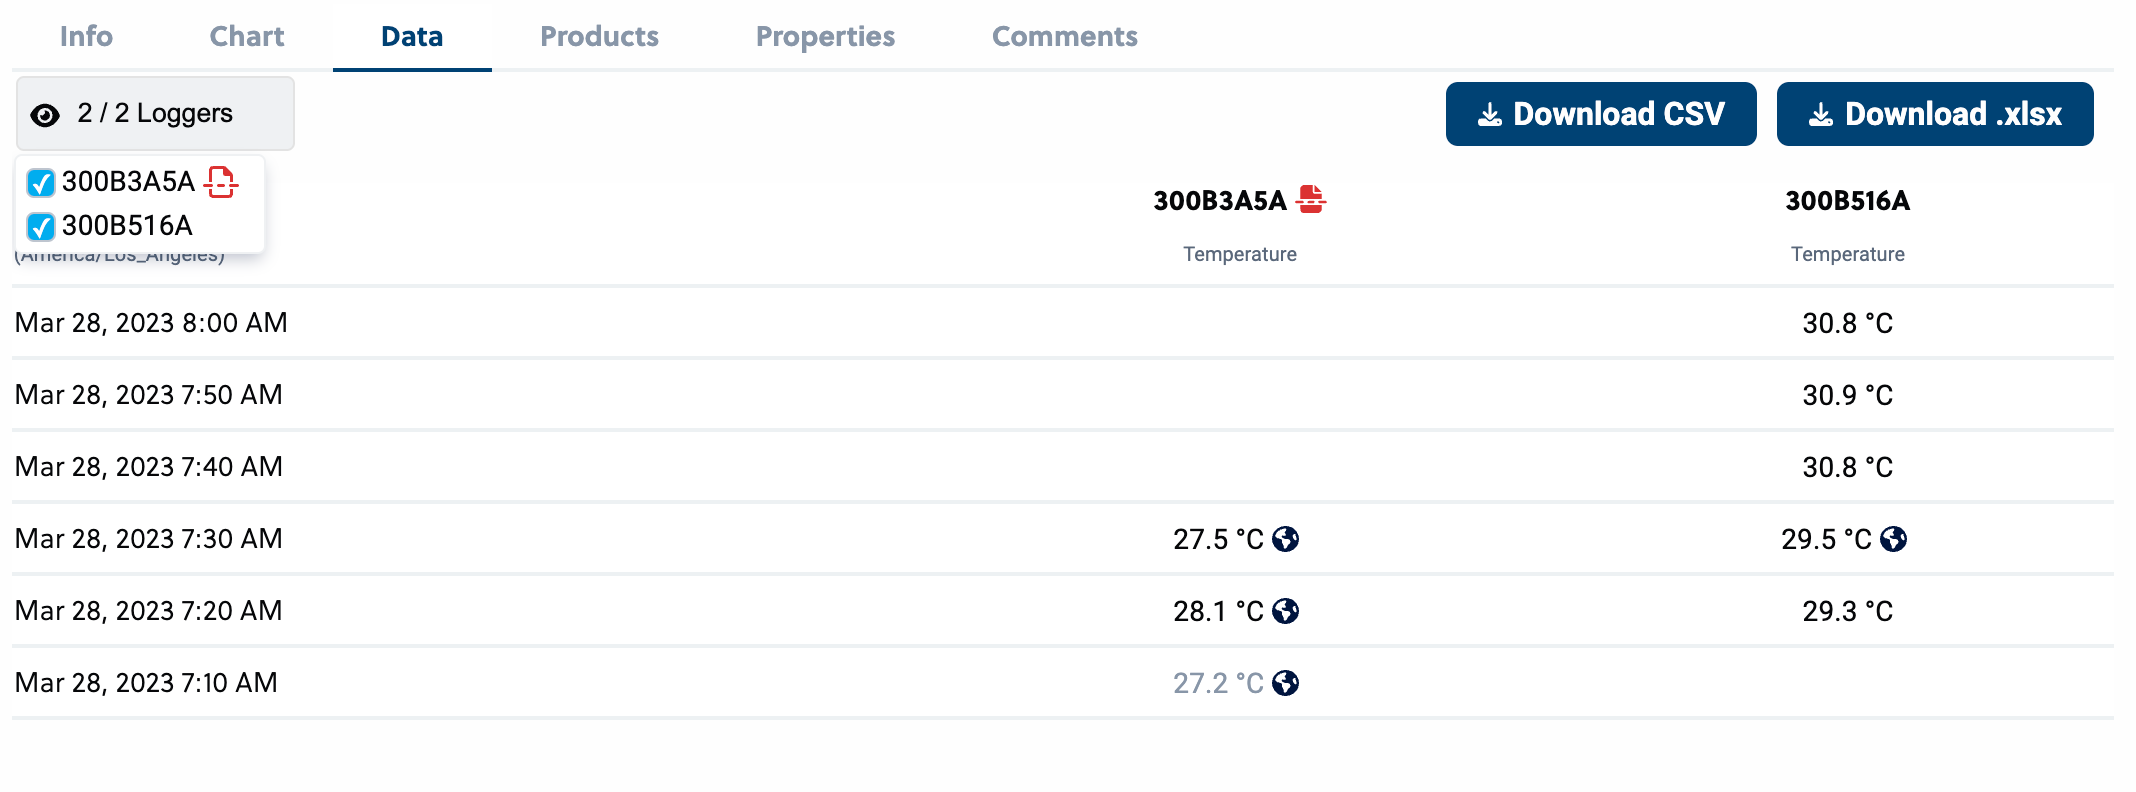
The data tab will display the loggers with missing data on the columns and the dropdown.
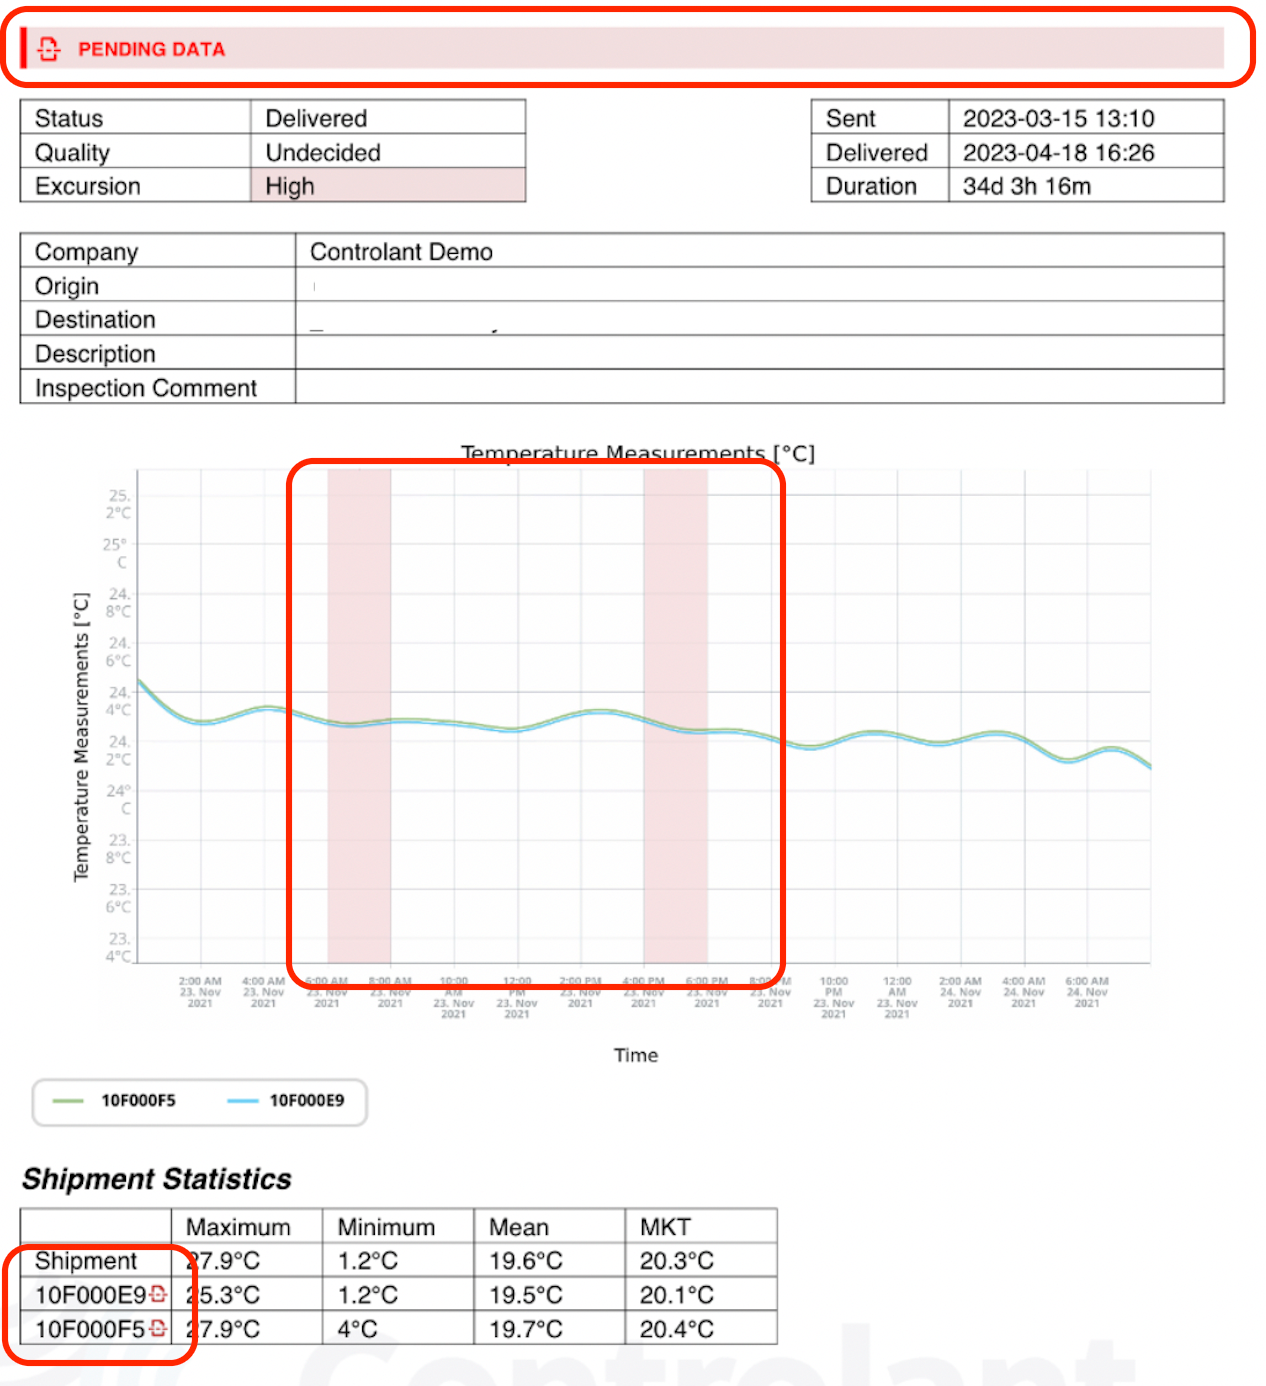
The PDF report will also receive a “Pending Data” banner if a report is requested before the shipment can be fully analyzed. The chart will contain some gaps, and loggers with pending data will be marked with a red icon.
SCMRS-600 | A user can see the next wake-up schedule of a logger. |
SCMRS-601 | A user can see data gaps in the chart on the pdf report. |
SCMRS-602 | A user receives feedback in the interface when there is pending data in a logger. |
Other UI Improvements
When creating a shipment, users can hover over a location and see its full detail before selecting it.
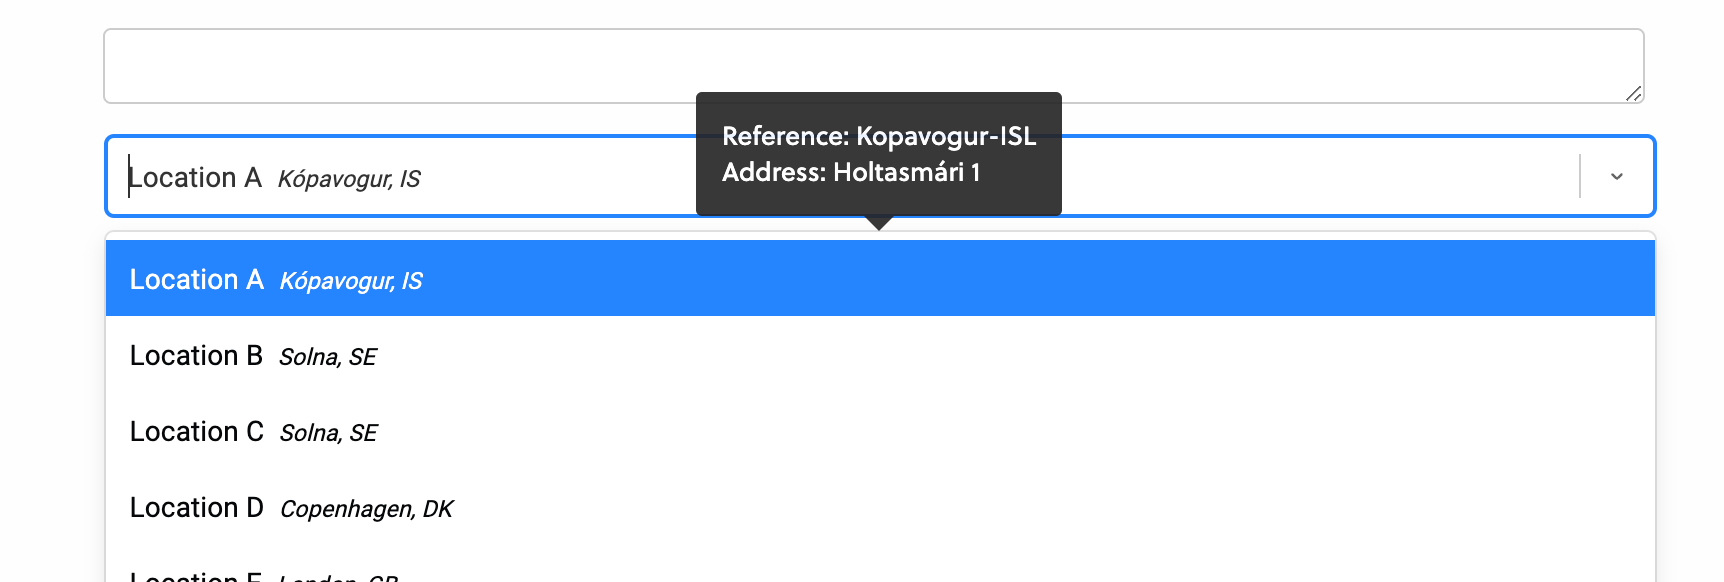
UX improvement as the user searches for locations during shipment creation, as they will be able to pick the correct one if a location has the same name.
When viewing shipments, you can collapse and expand the map.

UX improvement so users have more space to view the details of a shipment.
Removed limit of 6 loggers for the chart and data tab.
Note
Having many loggers with a lot of data might make the interface slower.
In user management, both for user creation and your own account, we have added a cleaner more reliable international code selector for the phone number.
Bug fix:
Keep non-closed shipments with an inspection quality set, but left at “not inspected” status from being removed from the shipment list in the UI. There was an edge case in which a user could set a quality status but not an inspection status for a shipment before closing, and that caused it to be removed from the inspection list.
Note
The shipment wasn't deleted; users could still search for it.
Other minor bug fixes.