Logistics
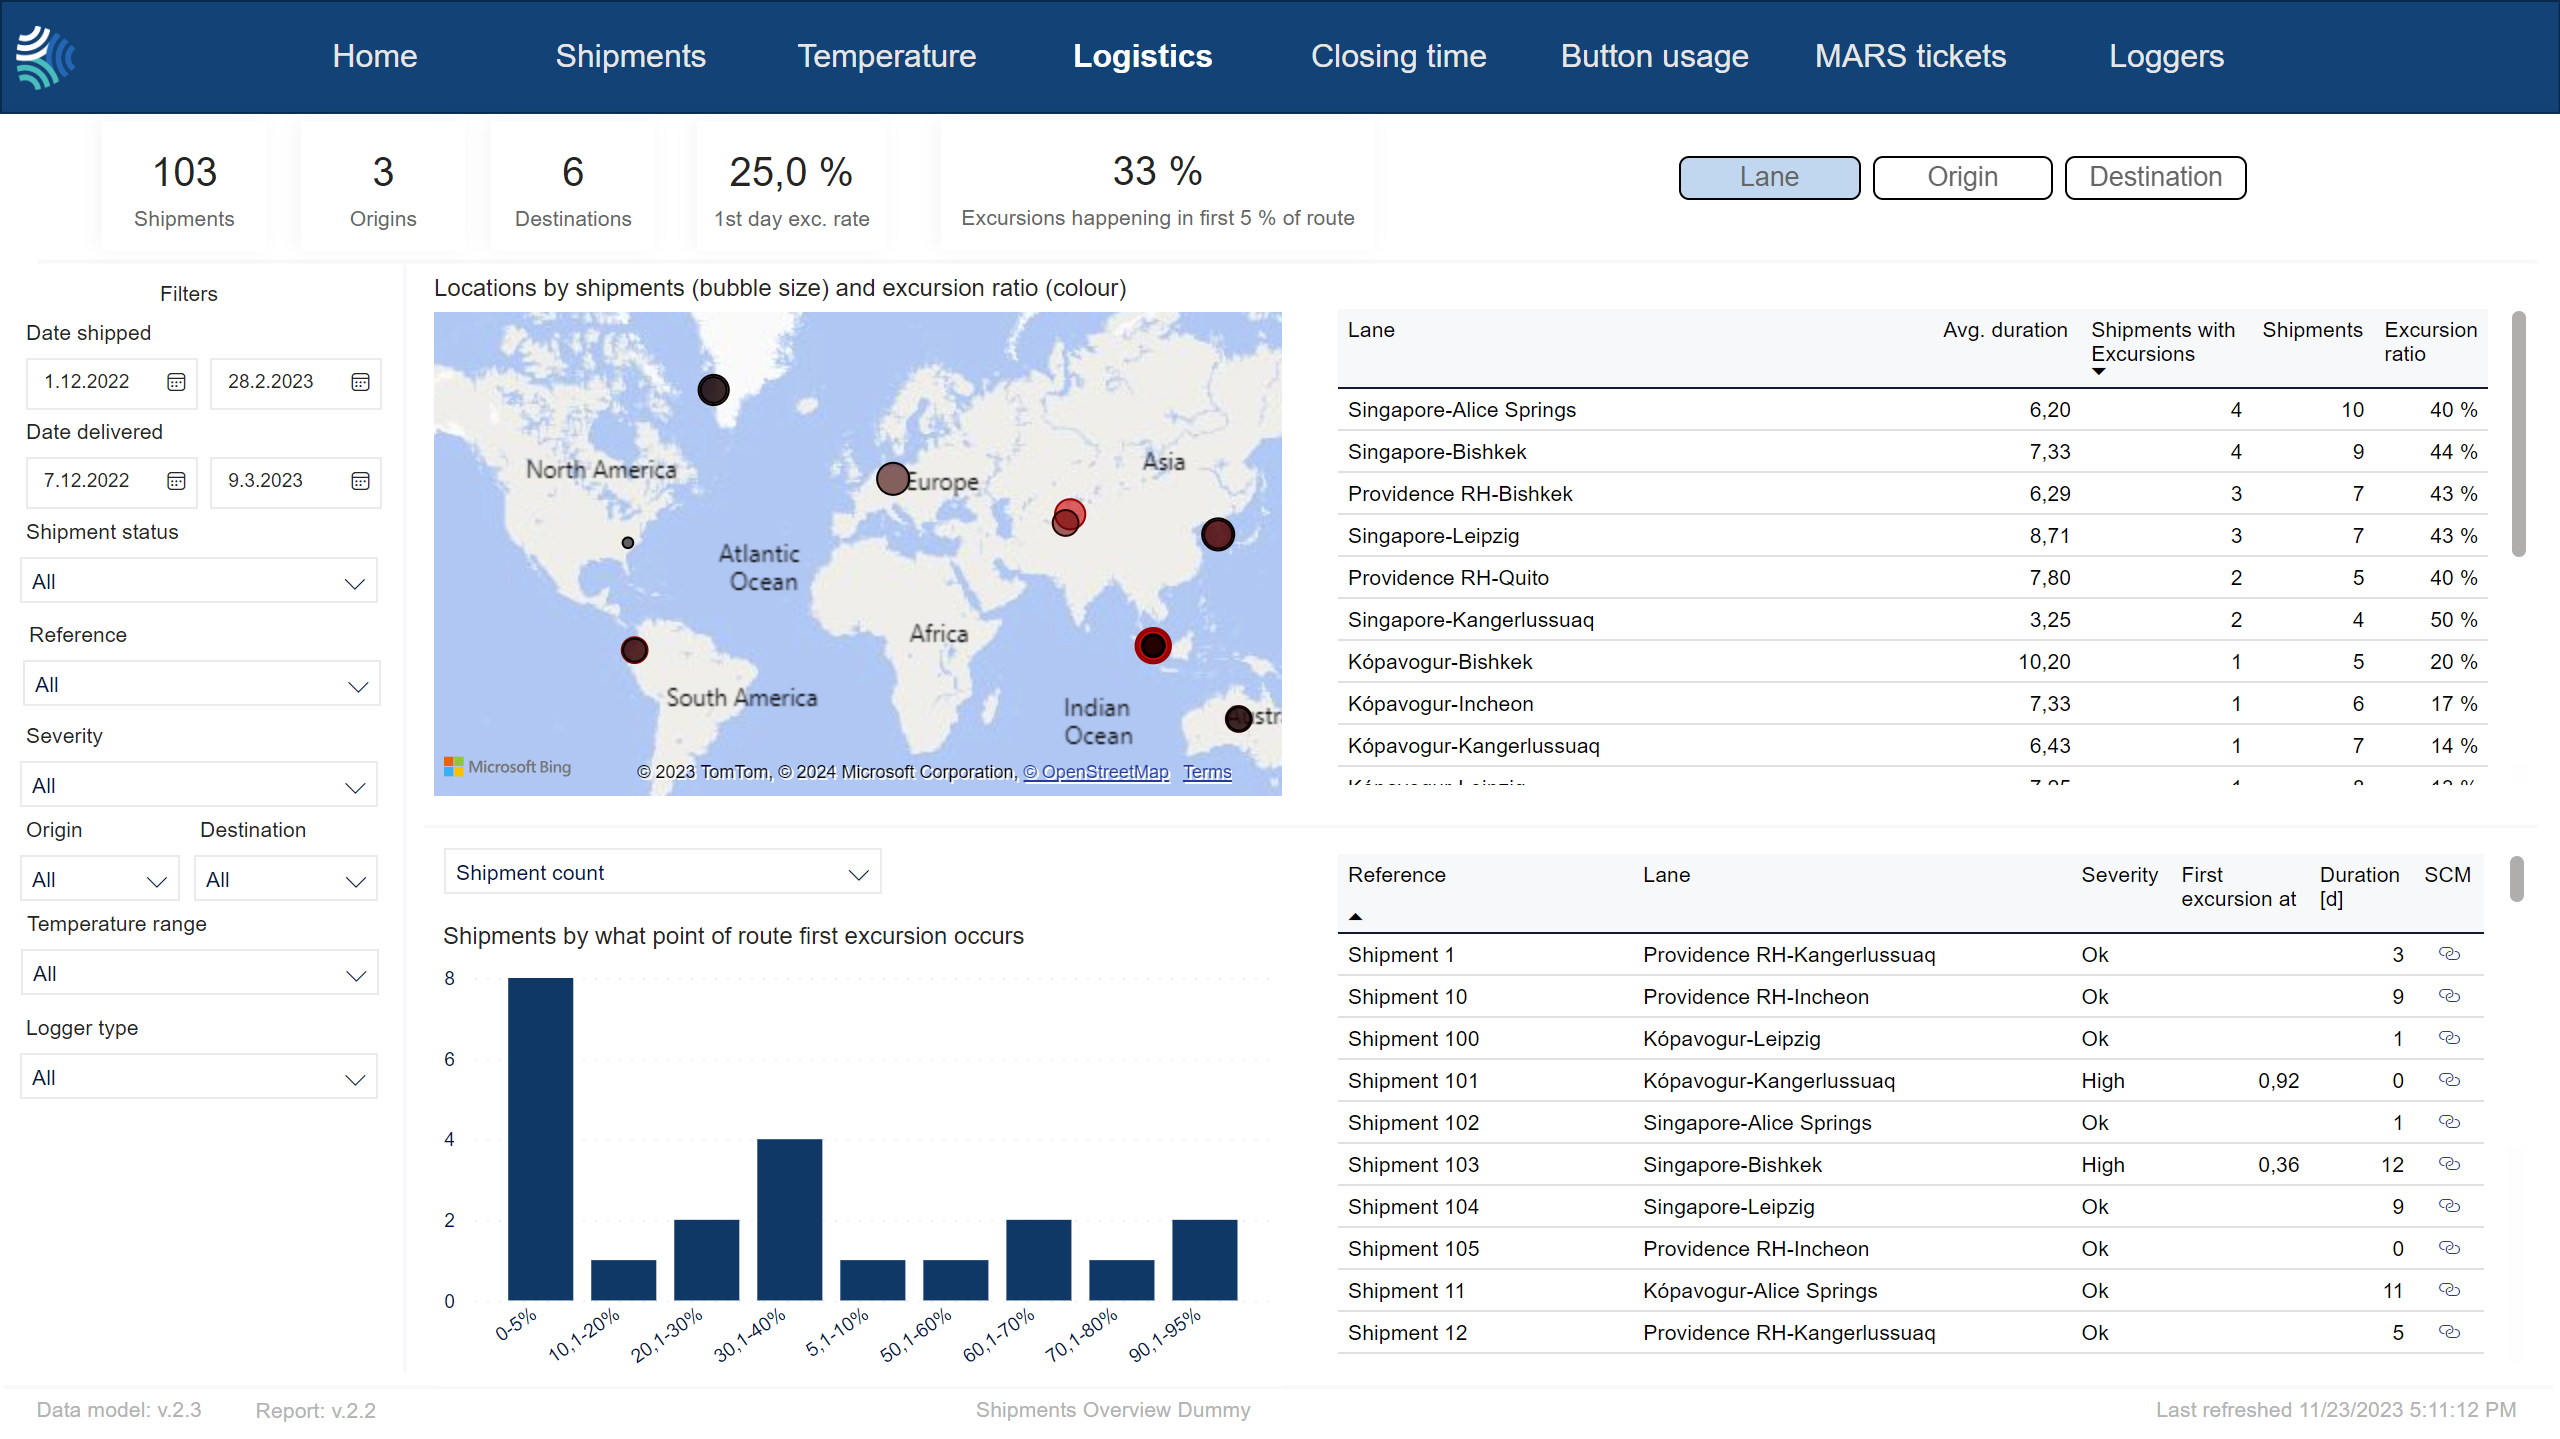
The Logistics page offers an overview of logistics performance by lane, origin, or destination for shipments that match the criteria set by the filter..
Note
You can configure the data displayed in any of the items below using the the filters and by doing the following:
Lanes:
To view data for all lanes for a specific period, configure the filter for that period.
To view data for a lane, the Lanes table, click the lane.
Origin
To view data for all origin locations for a specific period, configure the filter for that period.
To view data for an origin, do one of the following:
In the Locations by shipments and excursion ratio by lane map, click the bubble for the origin.
In the Lanes table, click the origin.
Destination
To view data for all destination locations for a specific period, configure the filter for that period.
To view data for a destination, do one of the following:
In the Locations by shipments and excursion ratio by lane map, click the bubble for the destination.
In the Lanes table, click the destination.
Logistics KPIs
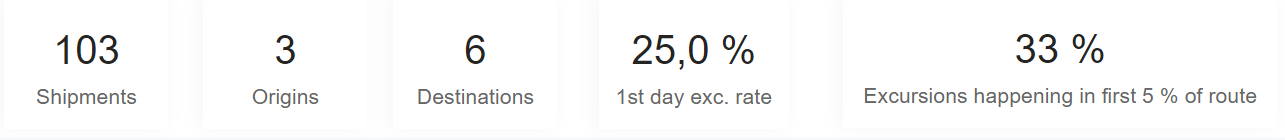
Key performance indicators for logistics for selected shipments.
Item | Description |
|---|---|
Shipments | |
Origins | Number of origin locations in shipments that match the criteria set by the filter. |
Destinations | Number of destination locations in shipments that match the criteria set by the filter. |
1st day exc. rate | Percentage of shipments with excursions that had the first excursion within the first 24 hours of the shipment. |
Shipments with excursion at Origin | Percentage of shipments that had an excursion logged at the origin location. |
Note
Not all customers have the same filters. You may not see all of the following filters, and you may have filters not included below.
Tip
For any filter, to clear it, click  .
.
You can use the filter to select shipments data to include in the report using the following criteria:
Item | Description |
|---|---|
Date shipped | Date range for the date shipment was started, in Type a date, or click
|
Date delivered | Date range for the date shipment was delivered, in Type a date, or click
|
Reference | Reference to unique identifier of shipment in customer's system. Click to select, or press CTRL and click to select more than one from the list. |
Severity | Severity of excursion. Click to select, or press CTRL and click to select more than one of the following: |
Status | Current status of shipment. Click to select, or press CTRL and click to select more than one of the following: |
Origin | Origin of shipment. Click to select, or press CTRL and click to select more than one from the list. |
Destination | Destination of shipment. Click to select, or press CTRL and click to select more than one from the list. |
Temperature range/ Stowage condition | Temperature range to filter for. Click to select, or press CTRL and click to select more than one from the list. |
Transportation mode | Transportation mode. Click to select, or press CTRL and click to select more than one from the list. Options include:
|
Carrier | Name of carrier. |
Logger type | Type of device. Click to select, or press CTRL and click to select more than one from the list. |

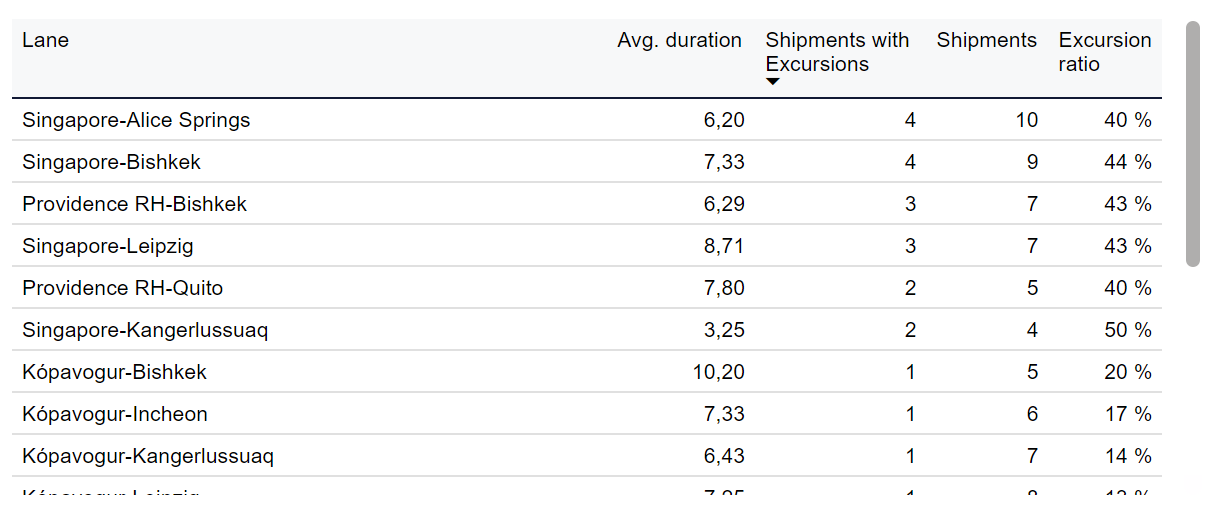
Table showing details about lanes.
Note
You can click a lane in the table to see details about that lane.
Item | Description |
|---|---|
Lane | Lane of shipment. |
Avg. duration | Average duration of shipments in this lane, in number of days. |
Shipments with Excursions | Number of shipments with excursions in this lane. |
Shipments | Number of shipments in this lane. |
Excursion ratio | Ratio of shipments with excursions in this lane. |
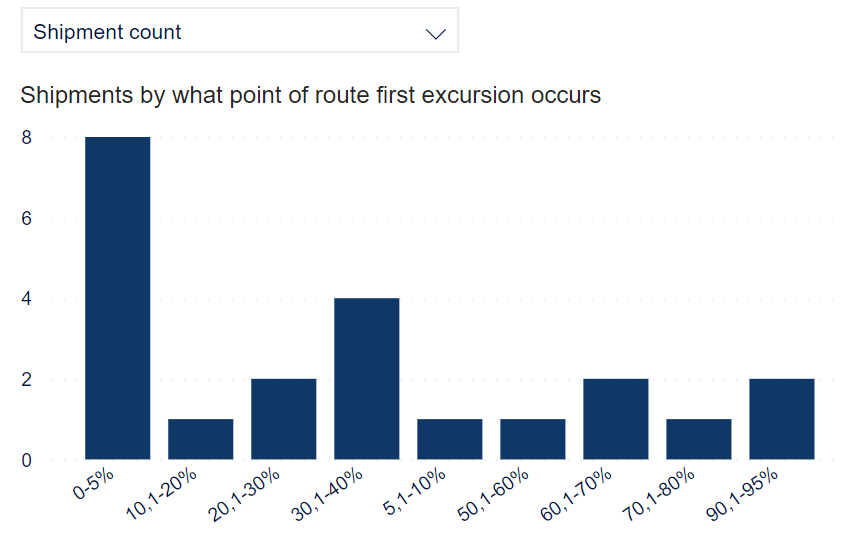
Chart showing the number of shipments grouped by the point in the route where the first excursion occurred.
Note
The data displayed depends on what is selected in the filters and whether a lane has been selected.
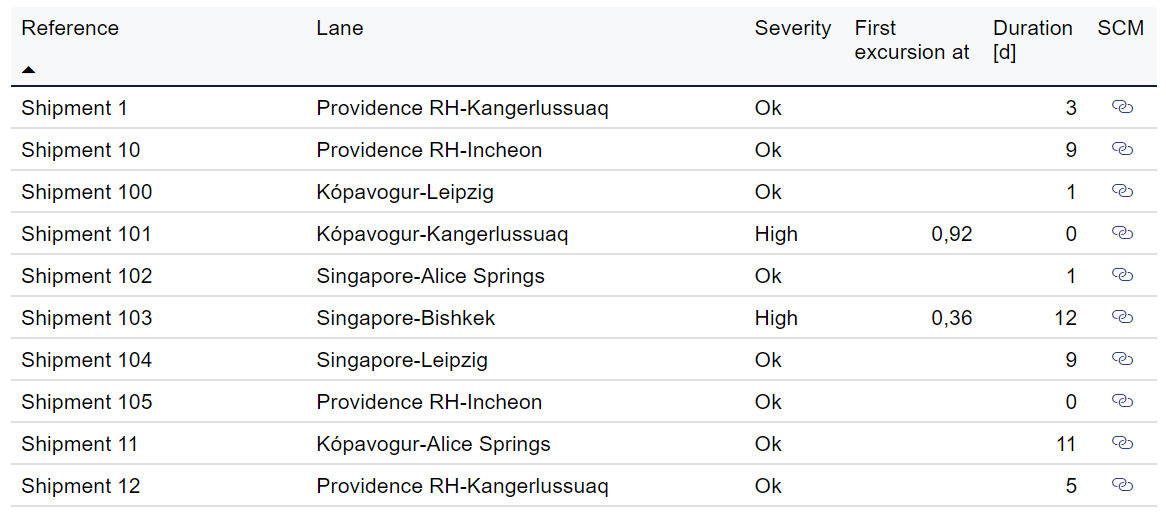
Table showing details about shipments.
Note
You can click a shipment in the table to see details about that shipment.
Item | Description |
|---|---|
Reference | Reference to unique identifier of shipment in customer's system. |
Lane | Lane of shipment. |
Severity | Severity of highest severity excursion in shipment. |
First excursion at | Point at which first excursion in shipment occurred, in 0-1 format. |
Duration [d] | Duration of shipment, in days. |
SCM | Link to shipment in Controlant Platform (SCM). |
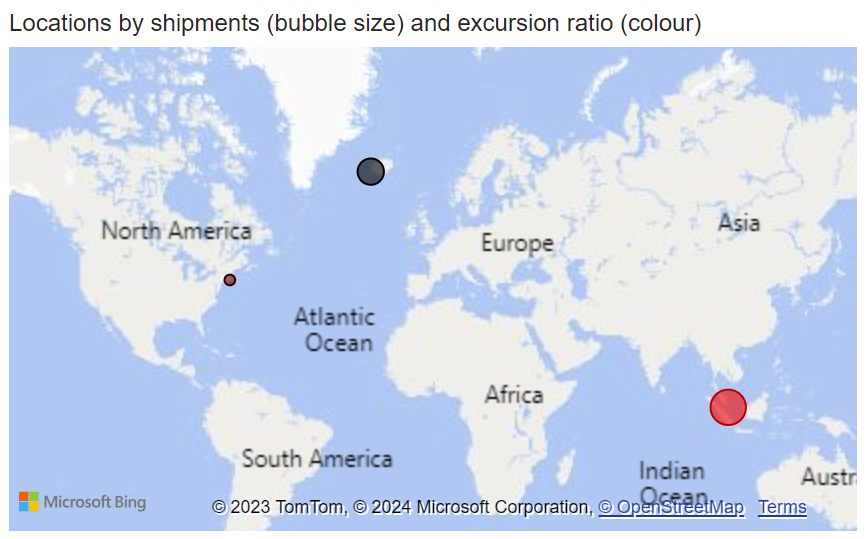
Map showing location of shipments and excursion ratio for origin locations:
Note
You can click a bubble in the map to see details about that origin.
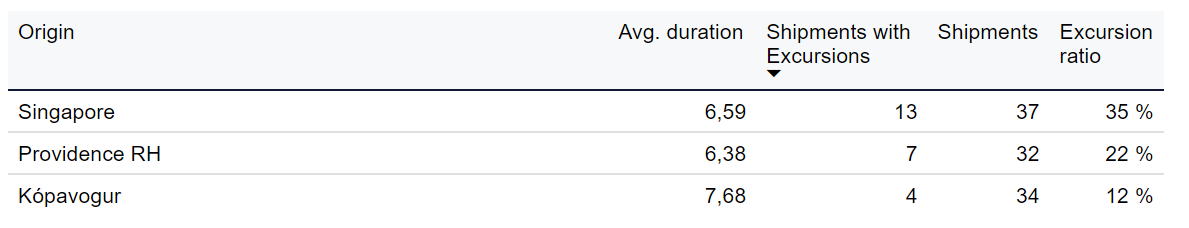
Table showing details about origins.
Note
You can click an origin location in the table to see details about that origin.
Item | Description |
|---|---|
Origin | Origin location of shipment. |
Avg. duration | Average duration of shipments from this origin location, in days. |
Shipments with Excursions | Number of shipments with excursions in this lane. |
Shipments | Number of shipments in this lane. |
Excursion ratio | Ratio of shipments with excursions in this lane. |
Chart showing the number of shipments grouped by the point in the route where the first excursion occurred.
Note
The data displayed depends on what is selected in the filters and whether an origin location has been selected.
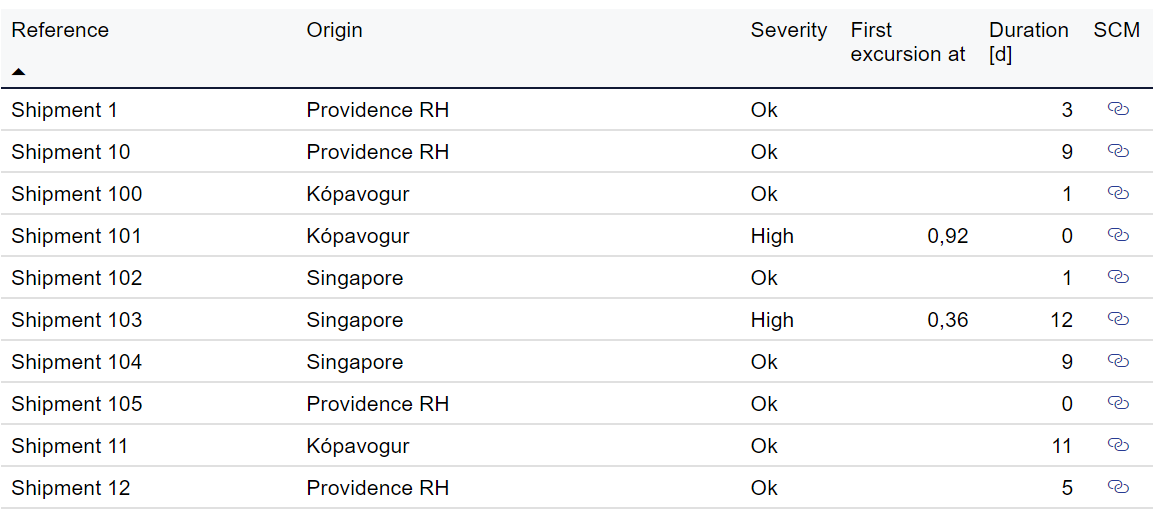
Table showing details about shipments.
Note
You can click a shipment in the table to see details about that shipment.
Item | Description |
|---|---|
Reference | Reference to unique identifier of shipment in customer's system. |
Origin | Origin location of shipment. |
Severity | Severity of highest severity excursion in shipment. |
First excursion at | Point at which first excursion in shipment occurred, in 0-1 format. |
Duration [d] | Duration of shipment, in days. |
SCM | Link to shipment in Controlant Platform (SCM). |
Map showing location of shipments and excursion ratio for destination locations that match the criteria set by the filter.:
Note
You can click a bubble in the map to see details about that destination.
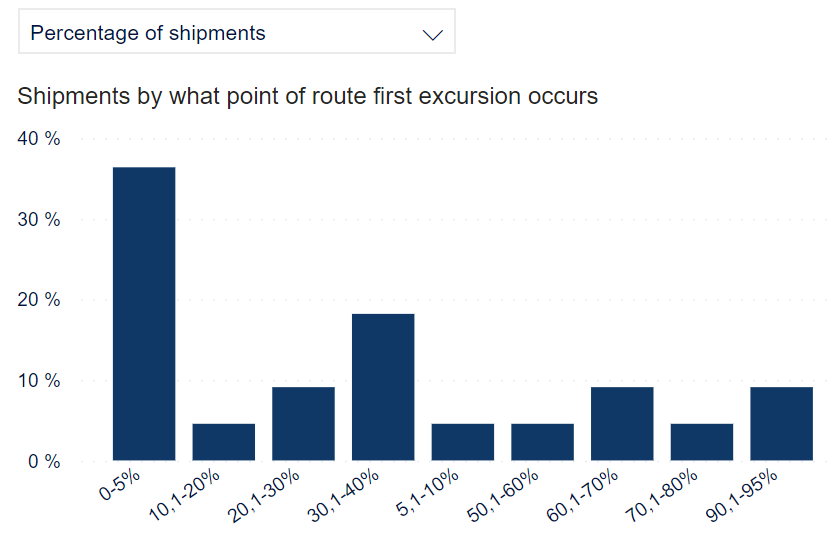
Table showing details about destination that match the criteria set by the filter.
Note
You can click a destination location in the table to see details about that destination.
Item | Description |
|---|---|
Destination | Destination location of shipment. |
Avg. duration | Average duration of shipments to this destination, in days. |
Shipments with Excursions | Number of shipments with excursions in this destination. |
Shipments | Number of shipments to this destination. |
Excursion ratio | Ratio of shipments with excursions in this destination. |
Chart showing the number of shipments grouped by the point in the route where the first excursion occurred.
Note
The data displayed depends on what is selected in the filters and whether an destination location has been selected.
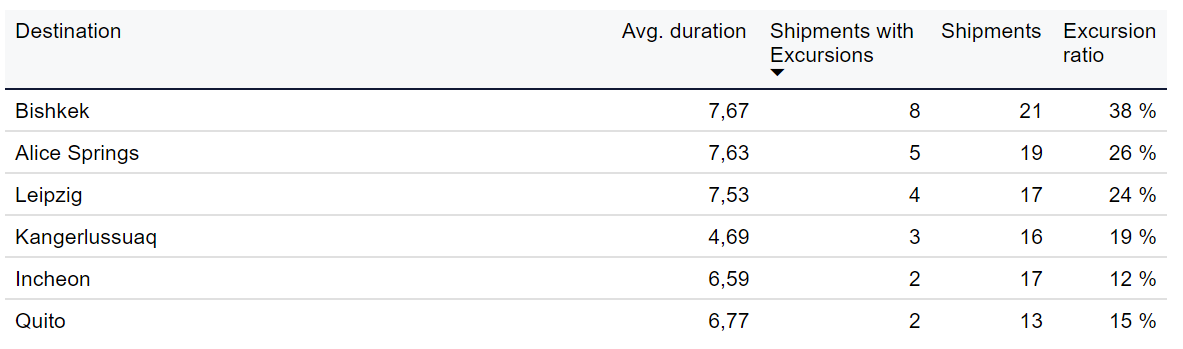
Table showing details about shipments that match the criteria set by the filter.
Note
You can click a shipment in the table to see details about that shipment.
Item | Description |
|---|---|
Reference | Reference to unique identifier of shipment in customer's system. |
Destination | Destination location of shipment. |
Severity | Severity of highest severity excursion in shipment. |
First excursion at | Point at which first excursion in shipment occurred, in 0-1 format. |
Duration [d] | Duration of shipment, in days. |
SCM | Link to shipment in Controlant Platform (SCM). |