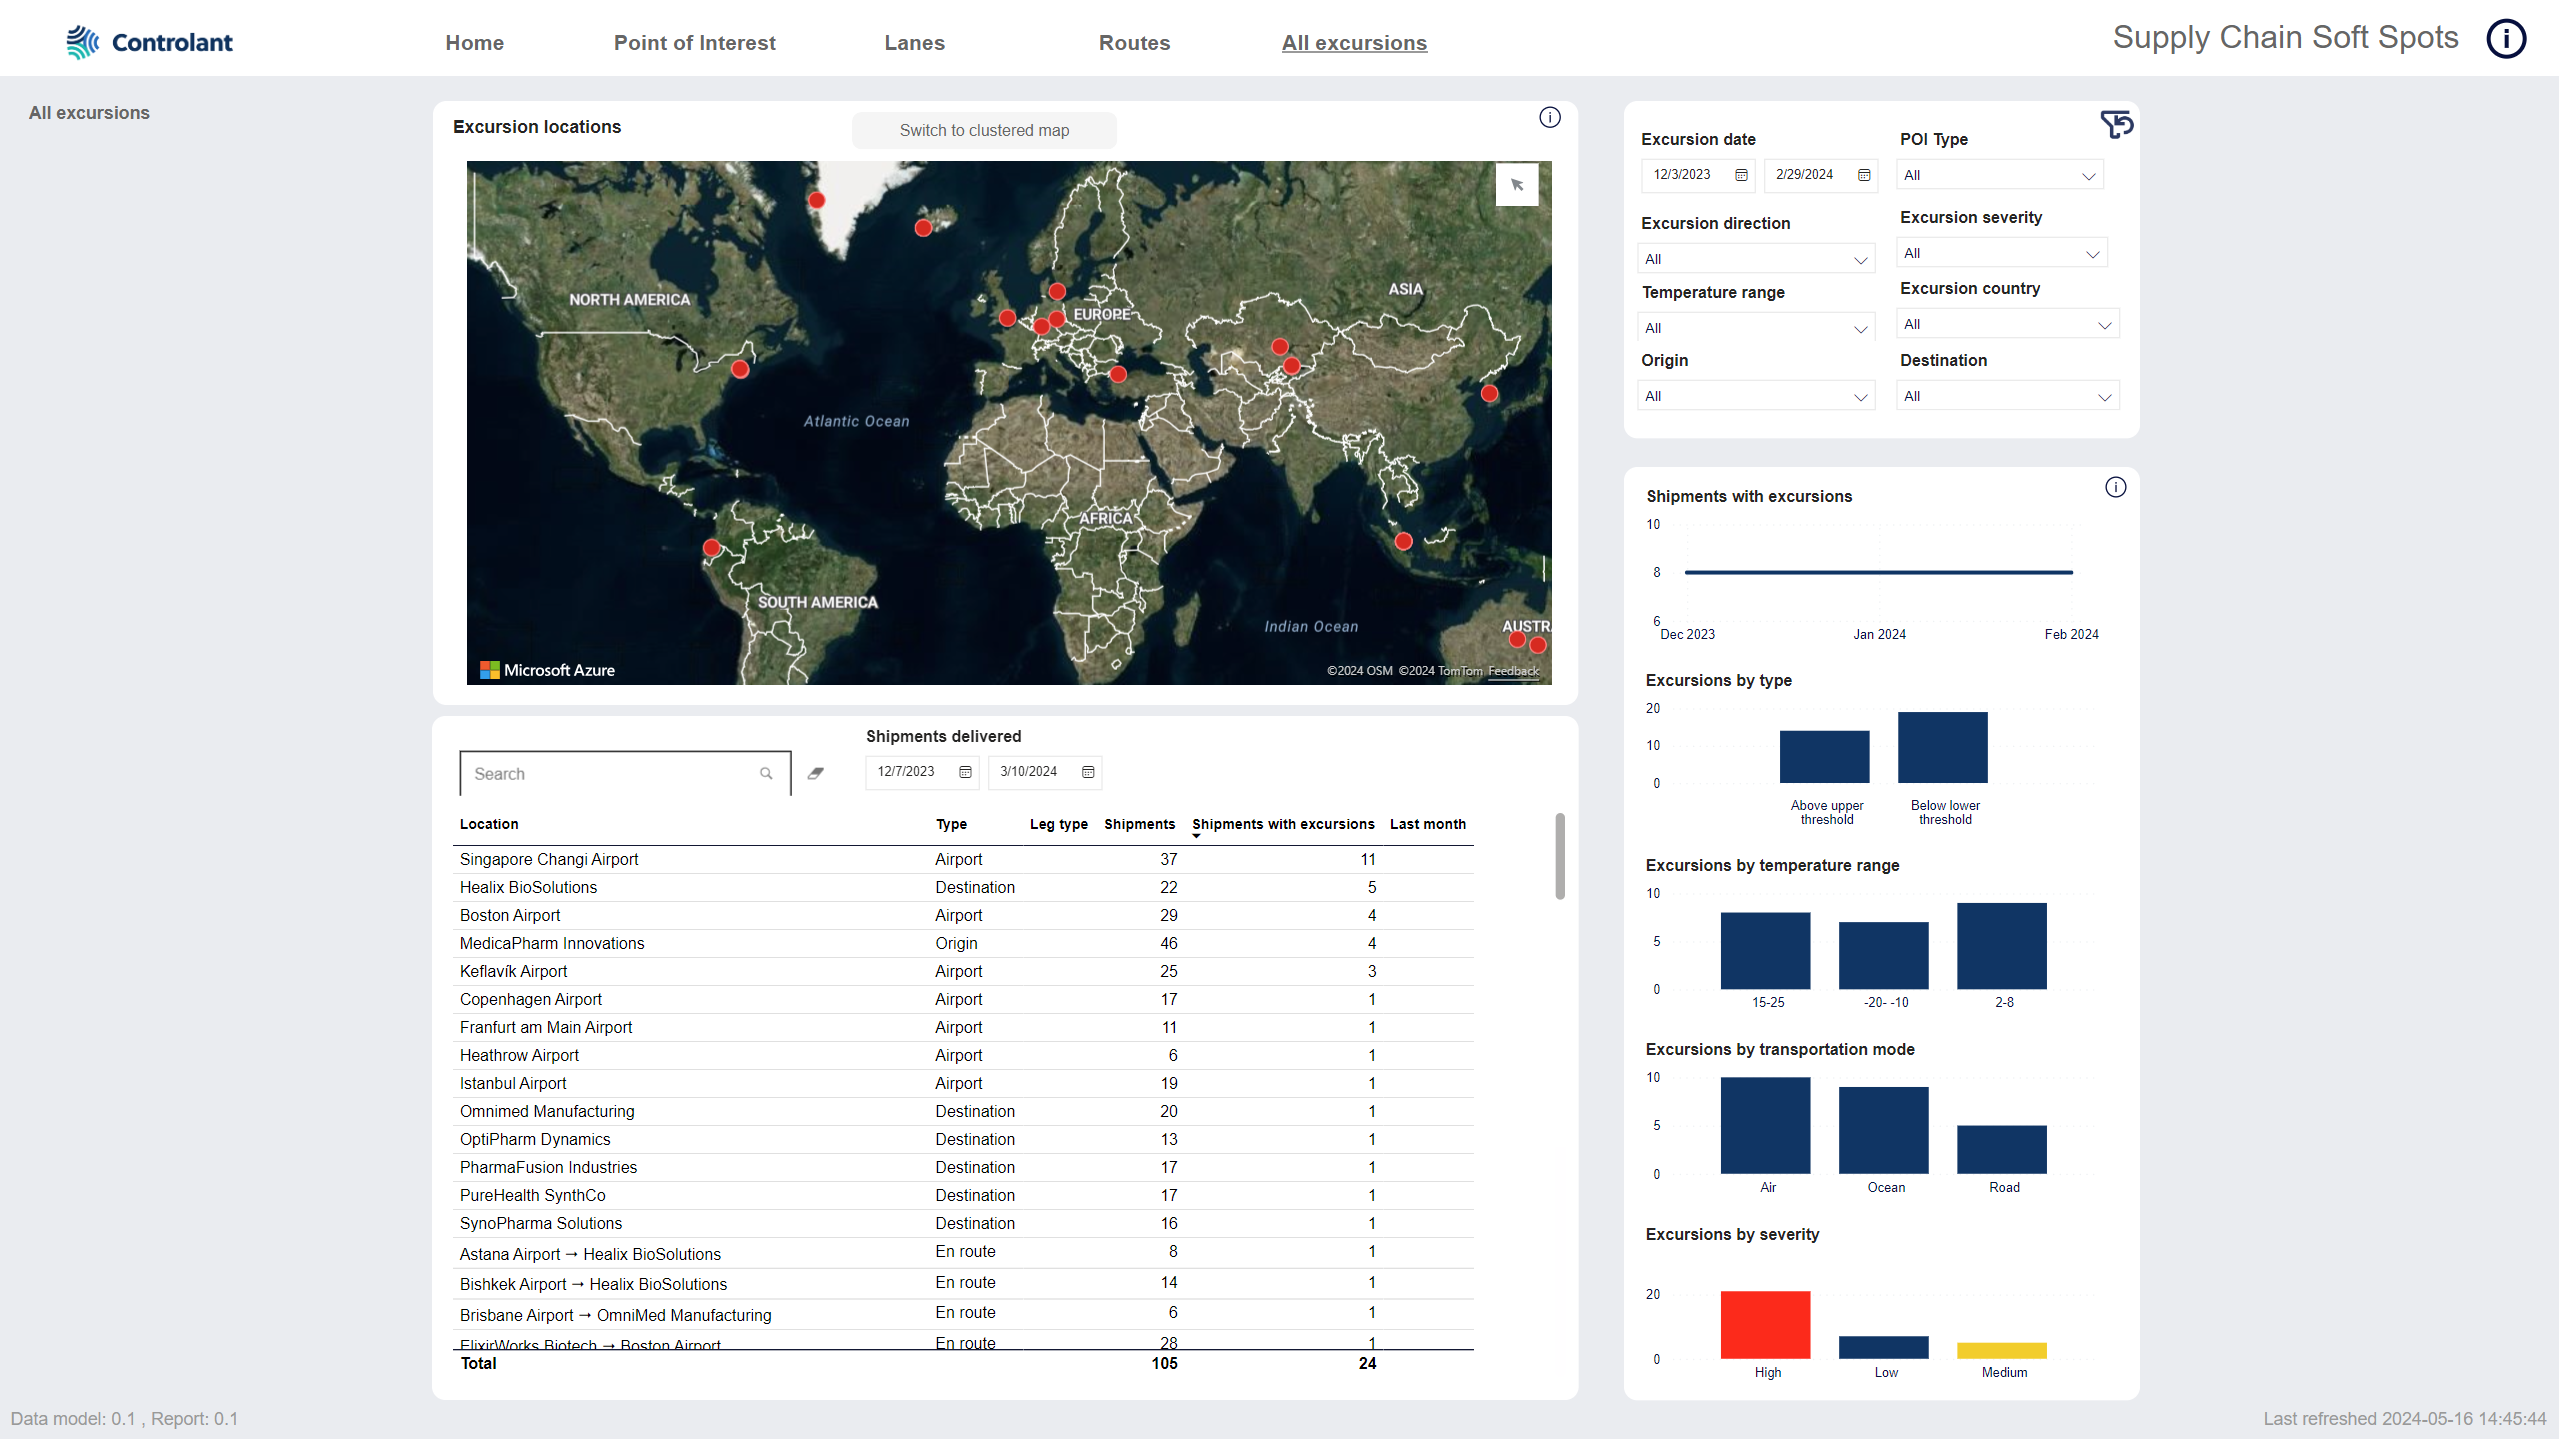
All excursions
The All excursions page shows information about all excursions:
Map showing location of excursions, clustered or non-clustered.
KPIs for excursions.
List of all locations/ legs that have excursions.
Tip
You can click a cluster to zoom in or click a location to filter the data on the page to that location.
Interactive map indicating location of excursions.
POIs are indicated with red: the stronger the red, the more excursions have occurred at the location.
Tip
You can hover over a POI to see the following information:
geocoordinates of location
name of location
number of shipments with excursions at location
Tip
You can select areas on the map using the selection mode:
 - point to and the selection mode options appear:
 - select a circular area
 - select a rectangular area
 - select a polygonal area
 - perform a range selection, to select an area within a specific distance or travel time from the selected point
The data in the page will update to show only POIs within the selected area.
You can zoom in and out on the map:
To zoom in on the map, do one of the following:
Double-click the map.
Scroll up with the scroll button on your mouse.
To zoom out on the map, scroll down with the scroll button on your mouse.
You can resize the map:
To see a larger map, click
 (focus mode).
A larger map appears.
To return to the dashboard, click Back to report.
The previous page appears.
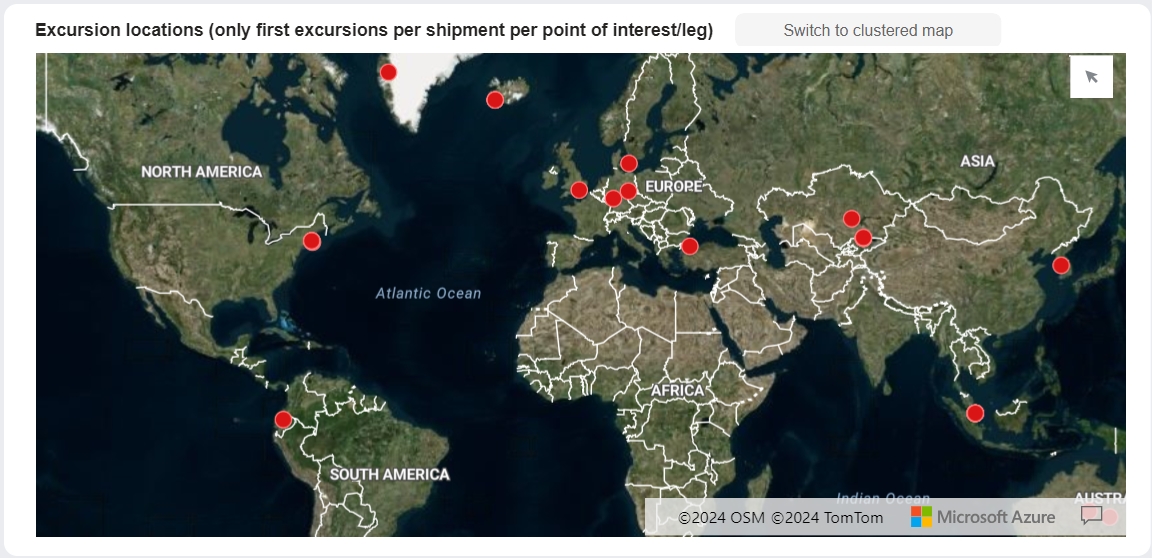
Interactive map showing location of excursions. Each excursion has a separate dot.
Tip
You can click a location to select that location. This will filter the table and the KPIs.
If necessary, to switch to the non-clustered map, click Switch to non-clustered map:

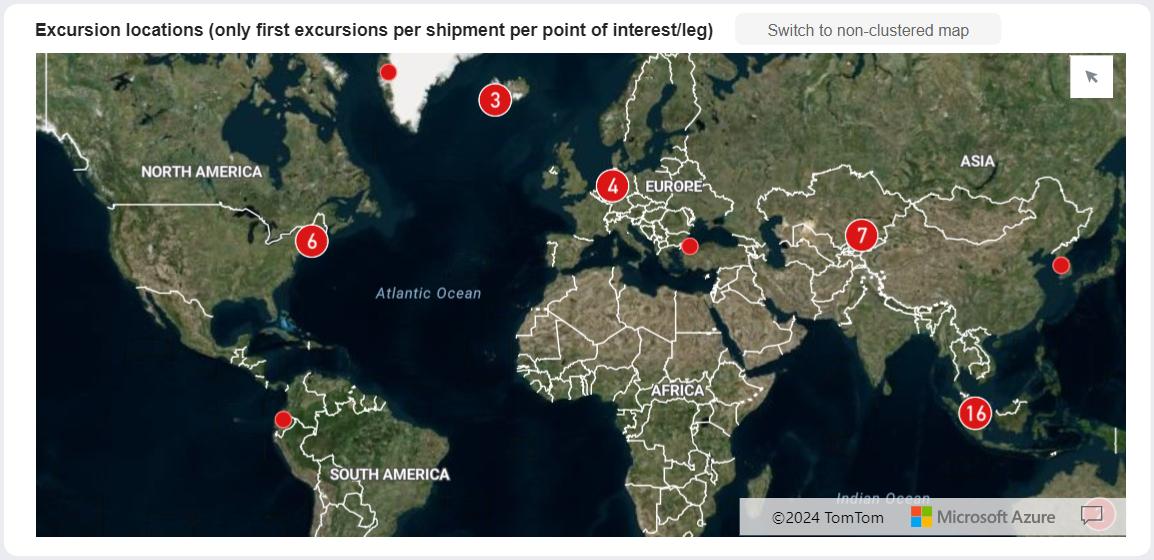
Interactive map showing location of excursions. Excursions that are close to each other are merged into clusters with a number.
Tip
You can click a cluster to zoom in to that cluster.
If necessary, to switch to the clustered map, click Switch to clustered map:

Tip
You can hover over a POI to see the following information:
geocoordinates of location
name of location
number of shipments with excursions at location
You can zoom in and out on the map:
To zoom in on the map, do one of the following:
Double-click the map.
Scroll up with the scroll button on your mouse.
To zoom out on the map, scroll down with the scroll button on your mouse.
You can resize the map:
To see a larger map, click
(focus mode).A larger map appears.
To return to the dashboard, click Back to report.
The previous page appears.
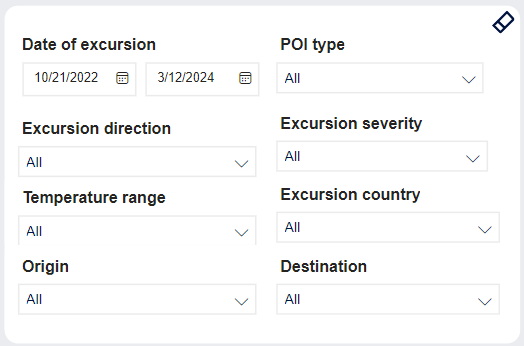
You can filter the contents of the page. Filter applies to the map, the table and the KPIs.
Tip
To clear the filter, click the eraser  .
.
Item | Description |
|---|---|
Date of excursion | Date range for excursion. Type a date, or click
|
POI type | Type of location for POI. Click to select, or press CTRL and click to select more than one of the following:: |
Excursion direction | Direction of excursion: Filter for excursions where temperature went above upper threshold or below lower threshold. Click to select, or press CTRL and click to select more than one from the list.
|
Excursion severity | Severity of excursion logged on shipment. Click to select, or press CTRL and click to select more than one of the following:
|
Temperature range | Temperature range configured for the shipment. Click to select, or press CTRL and click to select more than one from the list. |
Excursion country | Country the excursion occurred in. Click to select, or press CTRL and click to select more than one from the list. |
Origin | Origin location of shipment. Click to select, or press CTRL and click to select more than one from the list. |
Destination | Destination location of shipment. Click to select, or press CTRL and click to select more than one from the list. |

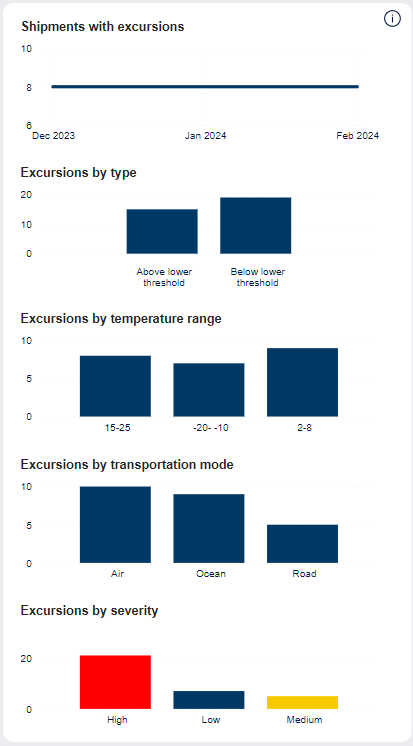
KPIs for shipments with excursions.
Tip
You can hover over images/graphs to see details in a pop-up.
Item | Description |
|---|---|
Shipments with excursions | 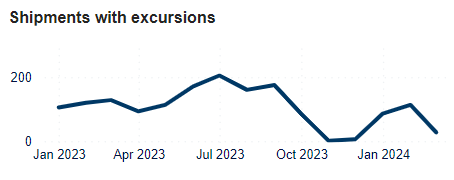 Number of shipments with excursions - trend for last 12 months. |
Excursions by type | 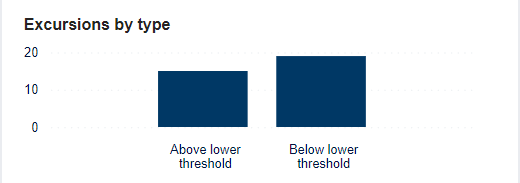 Number of shipments with excursions by type of excursion:
|
Excursions by temperature range | 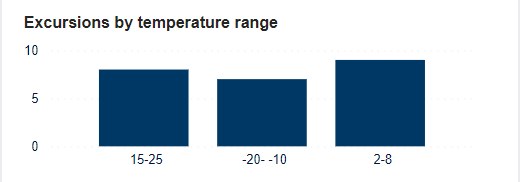 Number of shipments with excursions by temperature range configured for the shipment. |
Excursions by transportation mode | 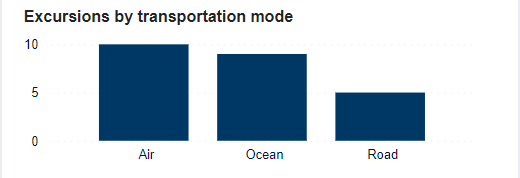 Number of shipments with excursions by mode of transportation. |
Excursions by severity | 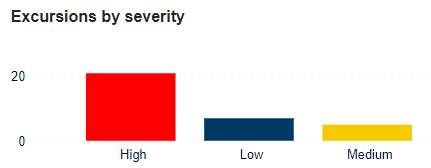 Number of shipments with excursions by severity:
|
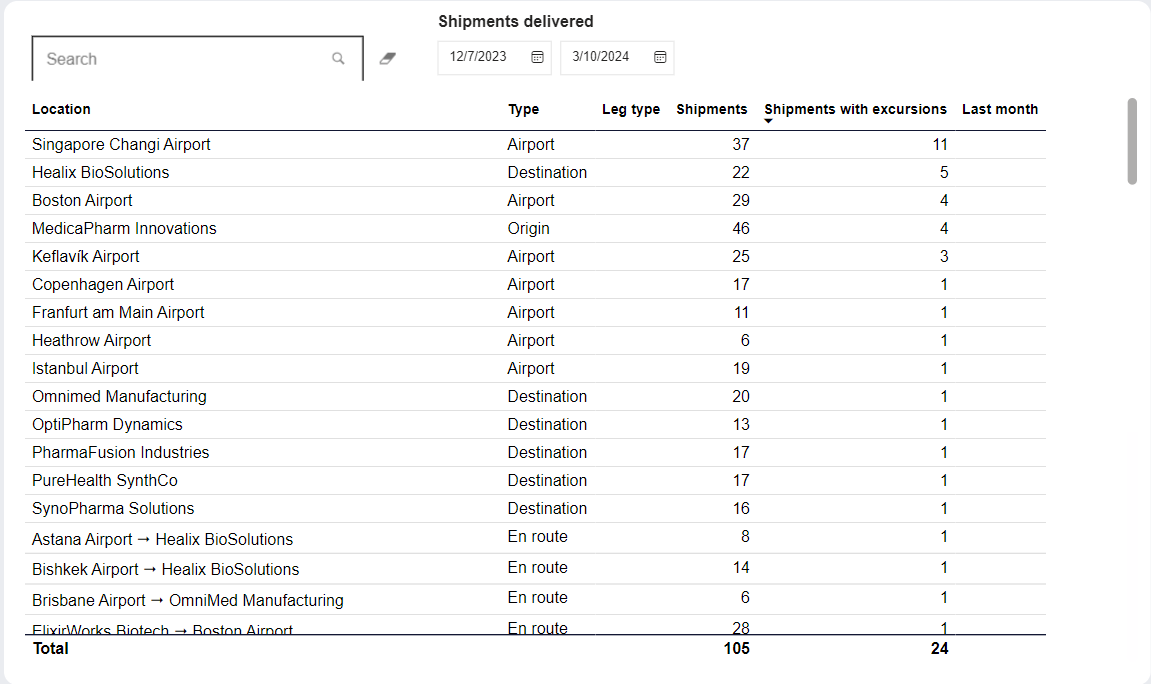
List of locations and details about each location.
You can filter the data in the page by the following parameters:
Item | Description |
|---|---|
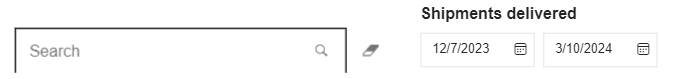
Search | Free text search. Type to filter the results by a location. TipTo clear the search filter, click the eraser |
Shipments delivered | Date range shipment was delivered. Type a date, or click
|
List of locations and details about each location.
Note
The background color of each location indicates the ratio of excursions that occur on that leg.
You can do the following with data in tables:
Export data:
Export the data with the current layout
Export summarized data:
as a comma separated values file, .csv
as an Excel file, .xlsx
Show as a table
Spotlight
Get insights
Sort descending
Sort ascending
Sort by column
Tip
You can click any column header to sort the contents of the table by the contents of that column. An arrow indicates the column the table is sorted by: An arrow pointing up indicates ascending order, and an arrow pointing down indicates descending order. Click the column header to toggle between the two.
Item | Description |
|---|---|
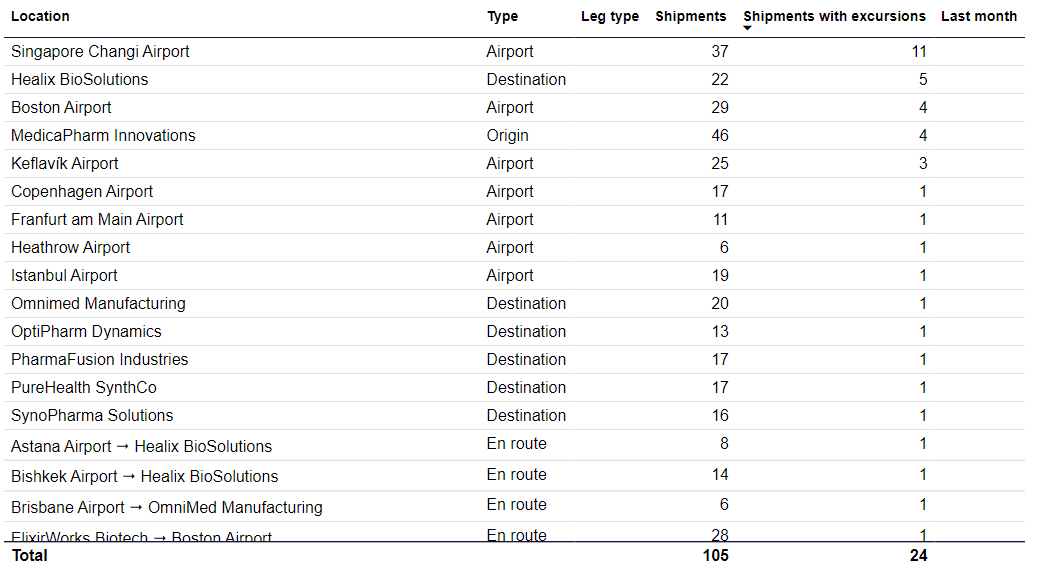
Location | Name of location. |
Type | Type of location: |
Leg type | Type of leg. Examples:
|
Shipments | Number of shipments at this location. |
Shipments with excursions | Number of shipments with excursions at this location. |
Last month | Number of shipments with excursions at this location in the previous calendar month. |
List of locations and details about each location.
Note
The background color of each location indicates the ratio of excursions that occur on that leg.
You can do the following with data in tables:
Export data:
Export the data with the current layout
Export summarized data:
as a comma separated values file, .csv
as an Excel file, .xlsx
Show as a table
Spotlight
Get insights
Sort descending
Sort ascending
Sort by column
Tip
You can click any column header to sort the contents of the table by the contents of that column. An arrow indicates the column the table is sorted by: An arrow pointing up indicates ascending order, and an arrow pointing down indicates descending order. Click the column header to toggle between the two.
Item | Description |
|---|---|
Location | Name of location. |
Type | Type of location: |
Country | Country of location. |
Shipments | Number of shipments at this location. |
Shipments with excursions | Number of shipments with excursions at this location. |
Last month | Number of shipments with excursions at this location in the previous calendar month. |