Locations - free version
Free version
This describes the free version of the dashboard. For more information about the premium version, please contact your Customer Success Manager.
The free version of the Locations page shows more details about Right First Time (RFT), Non-Right First Time (Non-RFT) and exceptions for the top five ranked lanes, filtered by lanes, origins, destinations or countries.
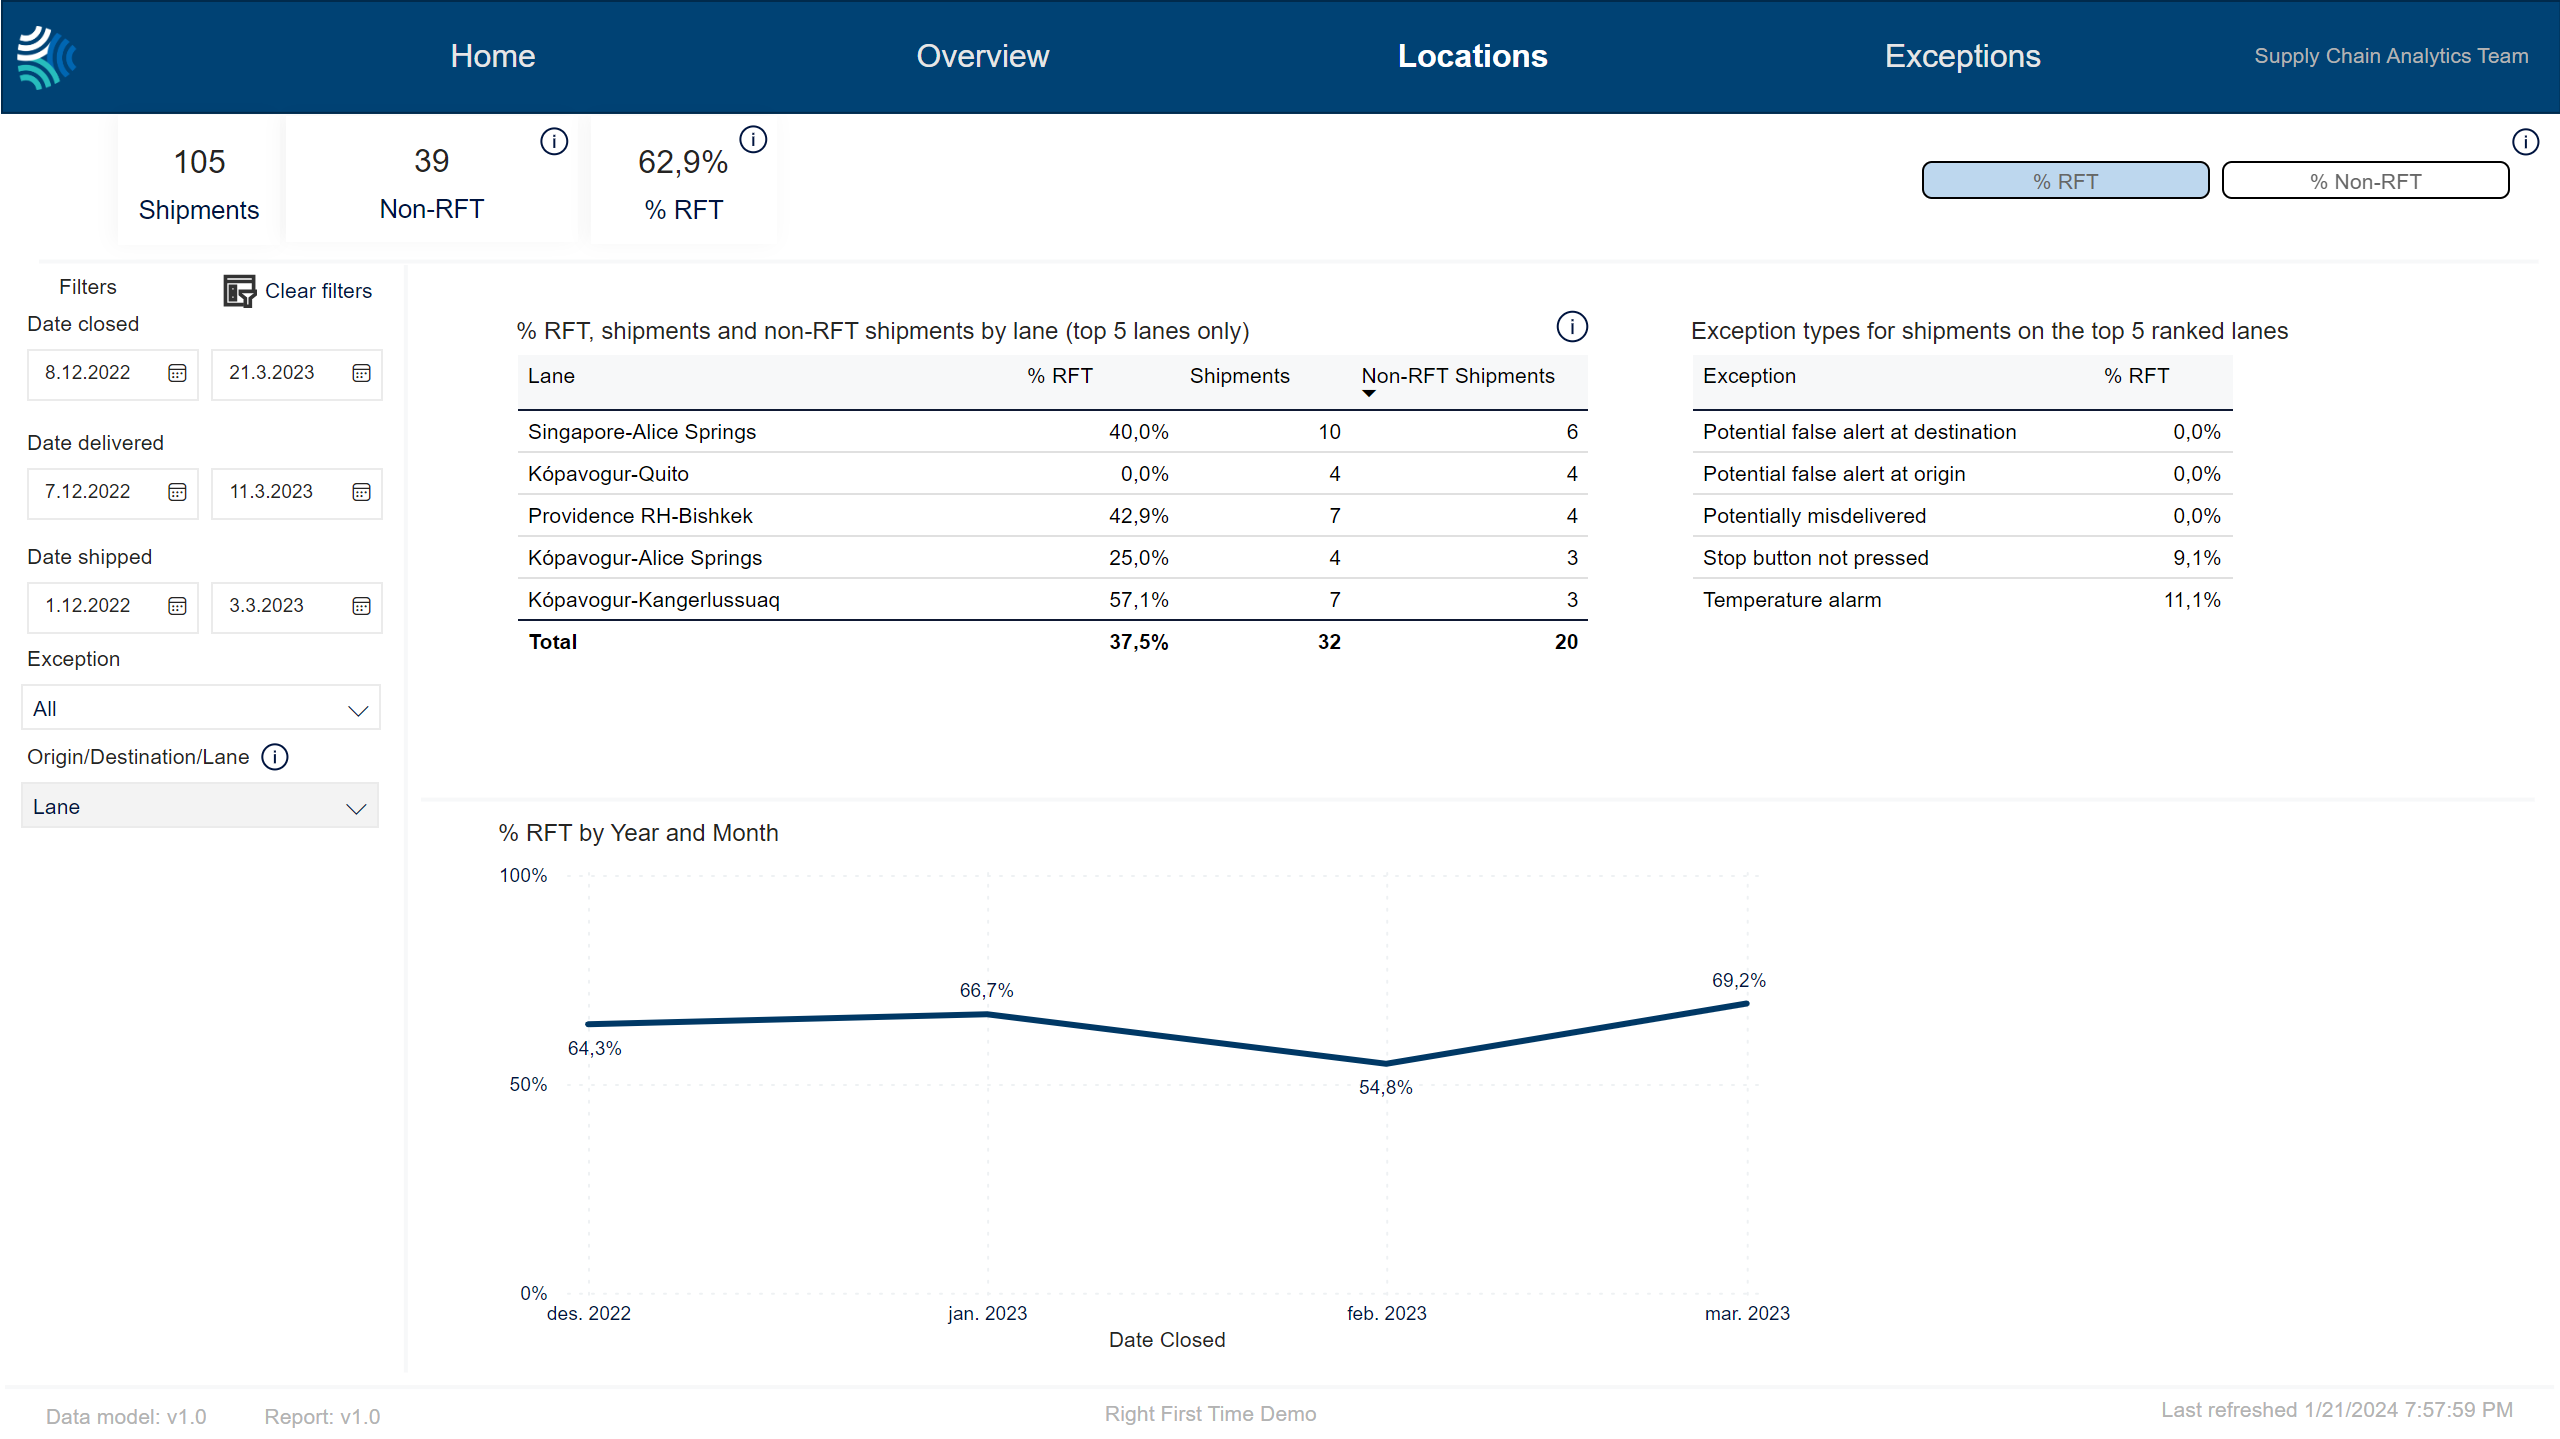

Key performance indicators for selected shipments.
Item | Description |
|---|---|
Shipments | Number of shipments closed in the selected period. The default period is 1 January 2023 – present. |
Non-RFT | Number of shipments that are Non-RFT in the selected period. |
% RFT | Ratio of RFT shipments out of the total number of shipments closed in the selected period. |
Note
Not all customers have the same filters. You may not see all of the following filters.
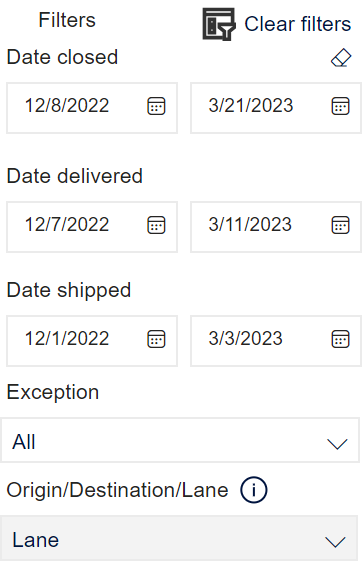
You can use the filter to select shipment data to include in the dashboard using the following criteria:
Note
For each filter, the list that appears will only include items that are present in the selected shipments.
Note
To clear all filters, click  .
.
Item | Description |
|---|---|
Date closed | Date range for the date shipment was closed, in Type a date, or click
|
Date delivered | Date range for the date shipment was delivered, in Type a date, or click
|
Date shipped | Date range for the date shipment was shipped, in Type a date, or click
|
Exception | Exception that occurred during shipment. Click to select, or press CTRL and click to select more than one of the following:: |
Note
The free version of the dashboard only shows data for the top five ranked lanes.
% RFT, shipments and non-RFT shipments by lane (top 5 lanes only) | % Non-RFT, shipments and non-RFT shipments by lane (top 5 lanes only) |
|---|---|
To see % RFT, shipments and non-RFT shipments by lane, click % RFT.  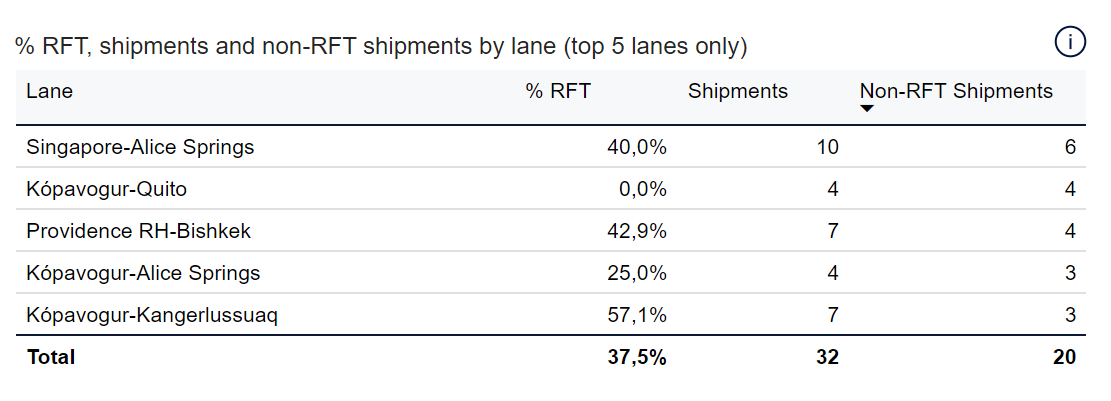 Ratio of RFT shipments by lane, for the top five ranked lanes. | To see % Non-RFT, shipments and non-RFT shipments by lane, click % Non-RFT.   Ratio of Non-RFT shipments by lane, for the top five ranked lanes. |
Item | Description |
|---|---|
Lane | Lane of shipment. Origin-destination of shipment.. |
% RFT / % Non-RFT | Ratio of shipments considered RFT / Non-RFT. |
Shipments | Total number of shipments selected. |
Non-RFT Shipment | Number of shipments considered Non-RFT on this lane. |
Note
The free version of the dashboard only shows data for the top five ranked lanes.
Exception types for shipments in the top 5 ranked lanes | Exception types for shipments in the top 5 ranked lanes |
|---|---|
To see Exception types for shipments in the top 5 ranked lanes, click % RFT.  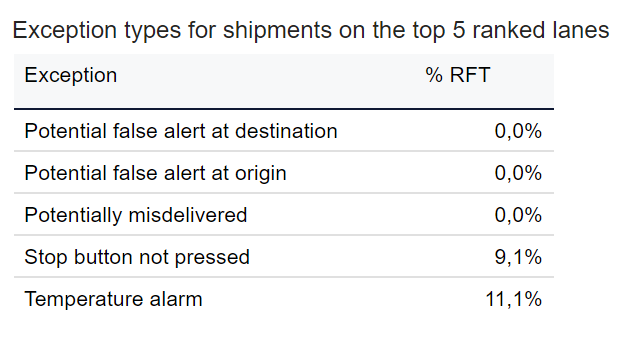 Exception types for shipments and ratio of RFT shipments, for the top five ranked lanes. | To see Exception types for shipments in the top 5 ranked lanes, click % Non-RFT.  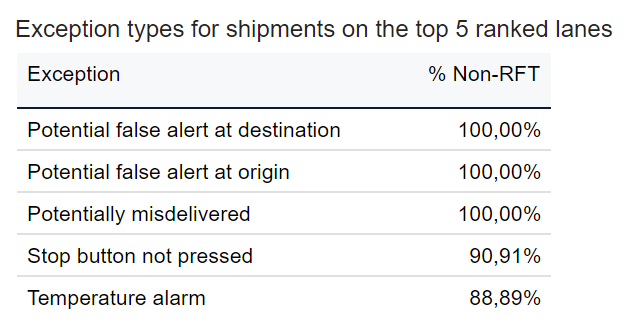 Exception types for shipments and ratio of non-RFT shipments, for the top five ranked lanes. |
Item | Description |
|---|---|
Exception | Type of exception: |
% RFT / % Non-RFT | Ratio of shipments considered RFT / Non-RFT because of this type of exception. |
Note
The free version of the dashboard only shows data for the top five ranked lanes.
% RFT by year and month | % Non-RFT by year and month |
|---|---|
To see % RFT by year and month, click % RFT.  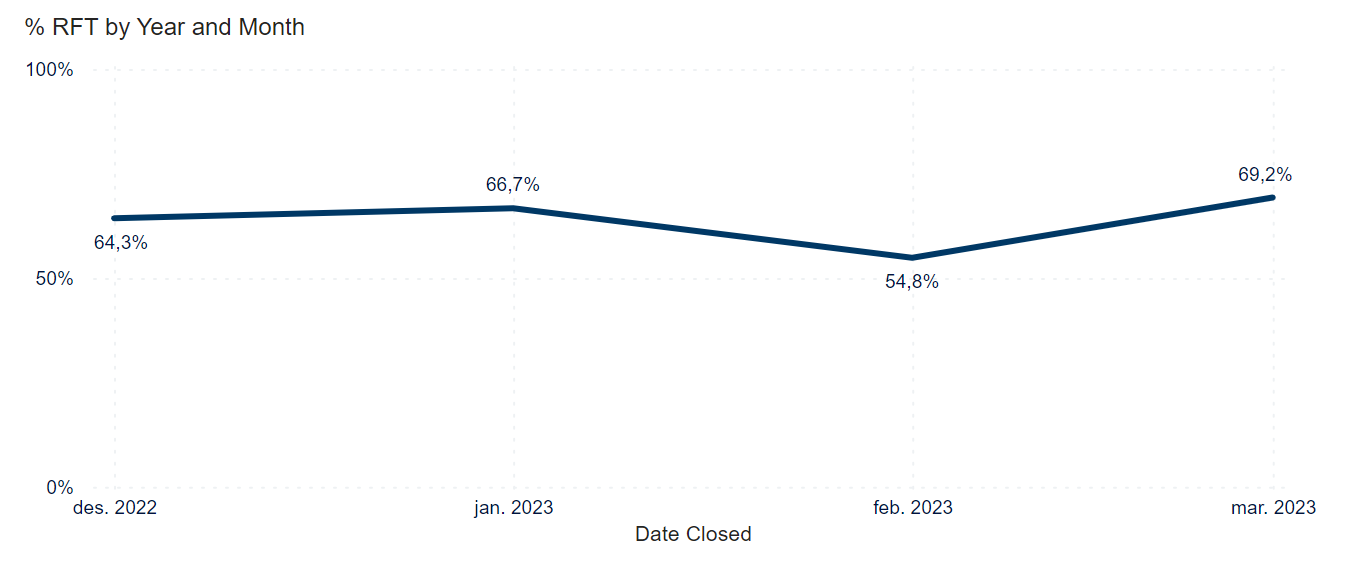 Ratio of shipments considered RFT by year and month, for the top five ranked lanes. | To see % Non-RFT by year and month, click % Non-RFT.  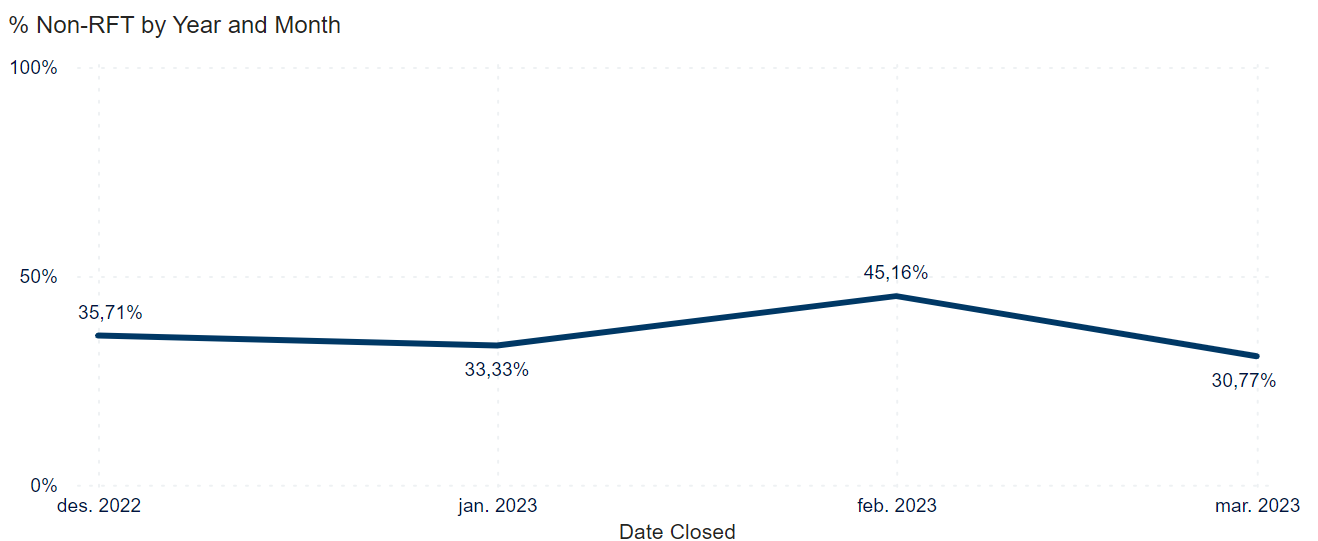 Ratio of shipments considered Non-RFT by year and month, for the top five ranked lanes. |
