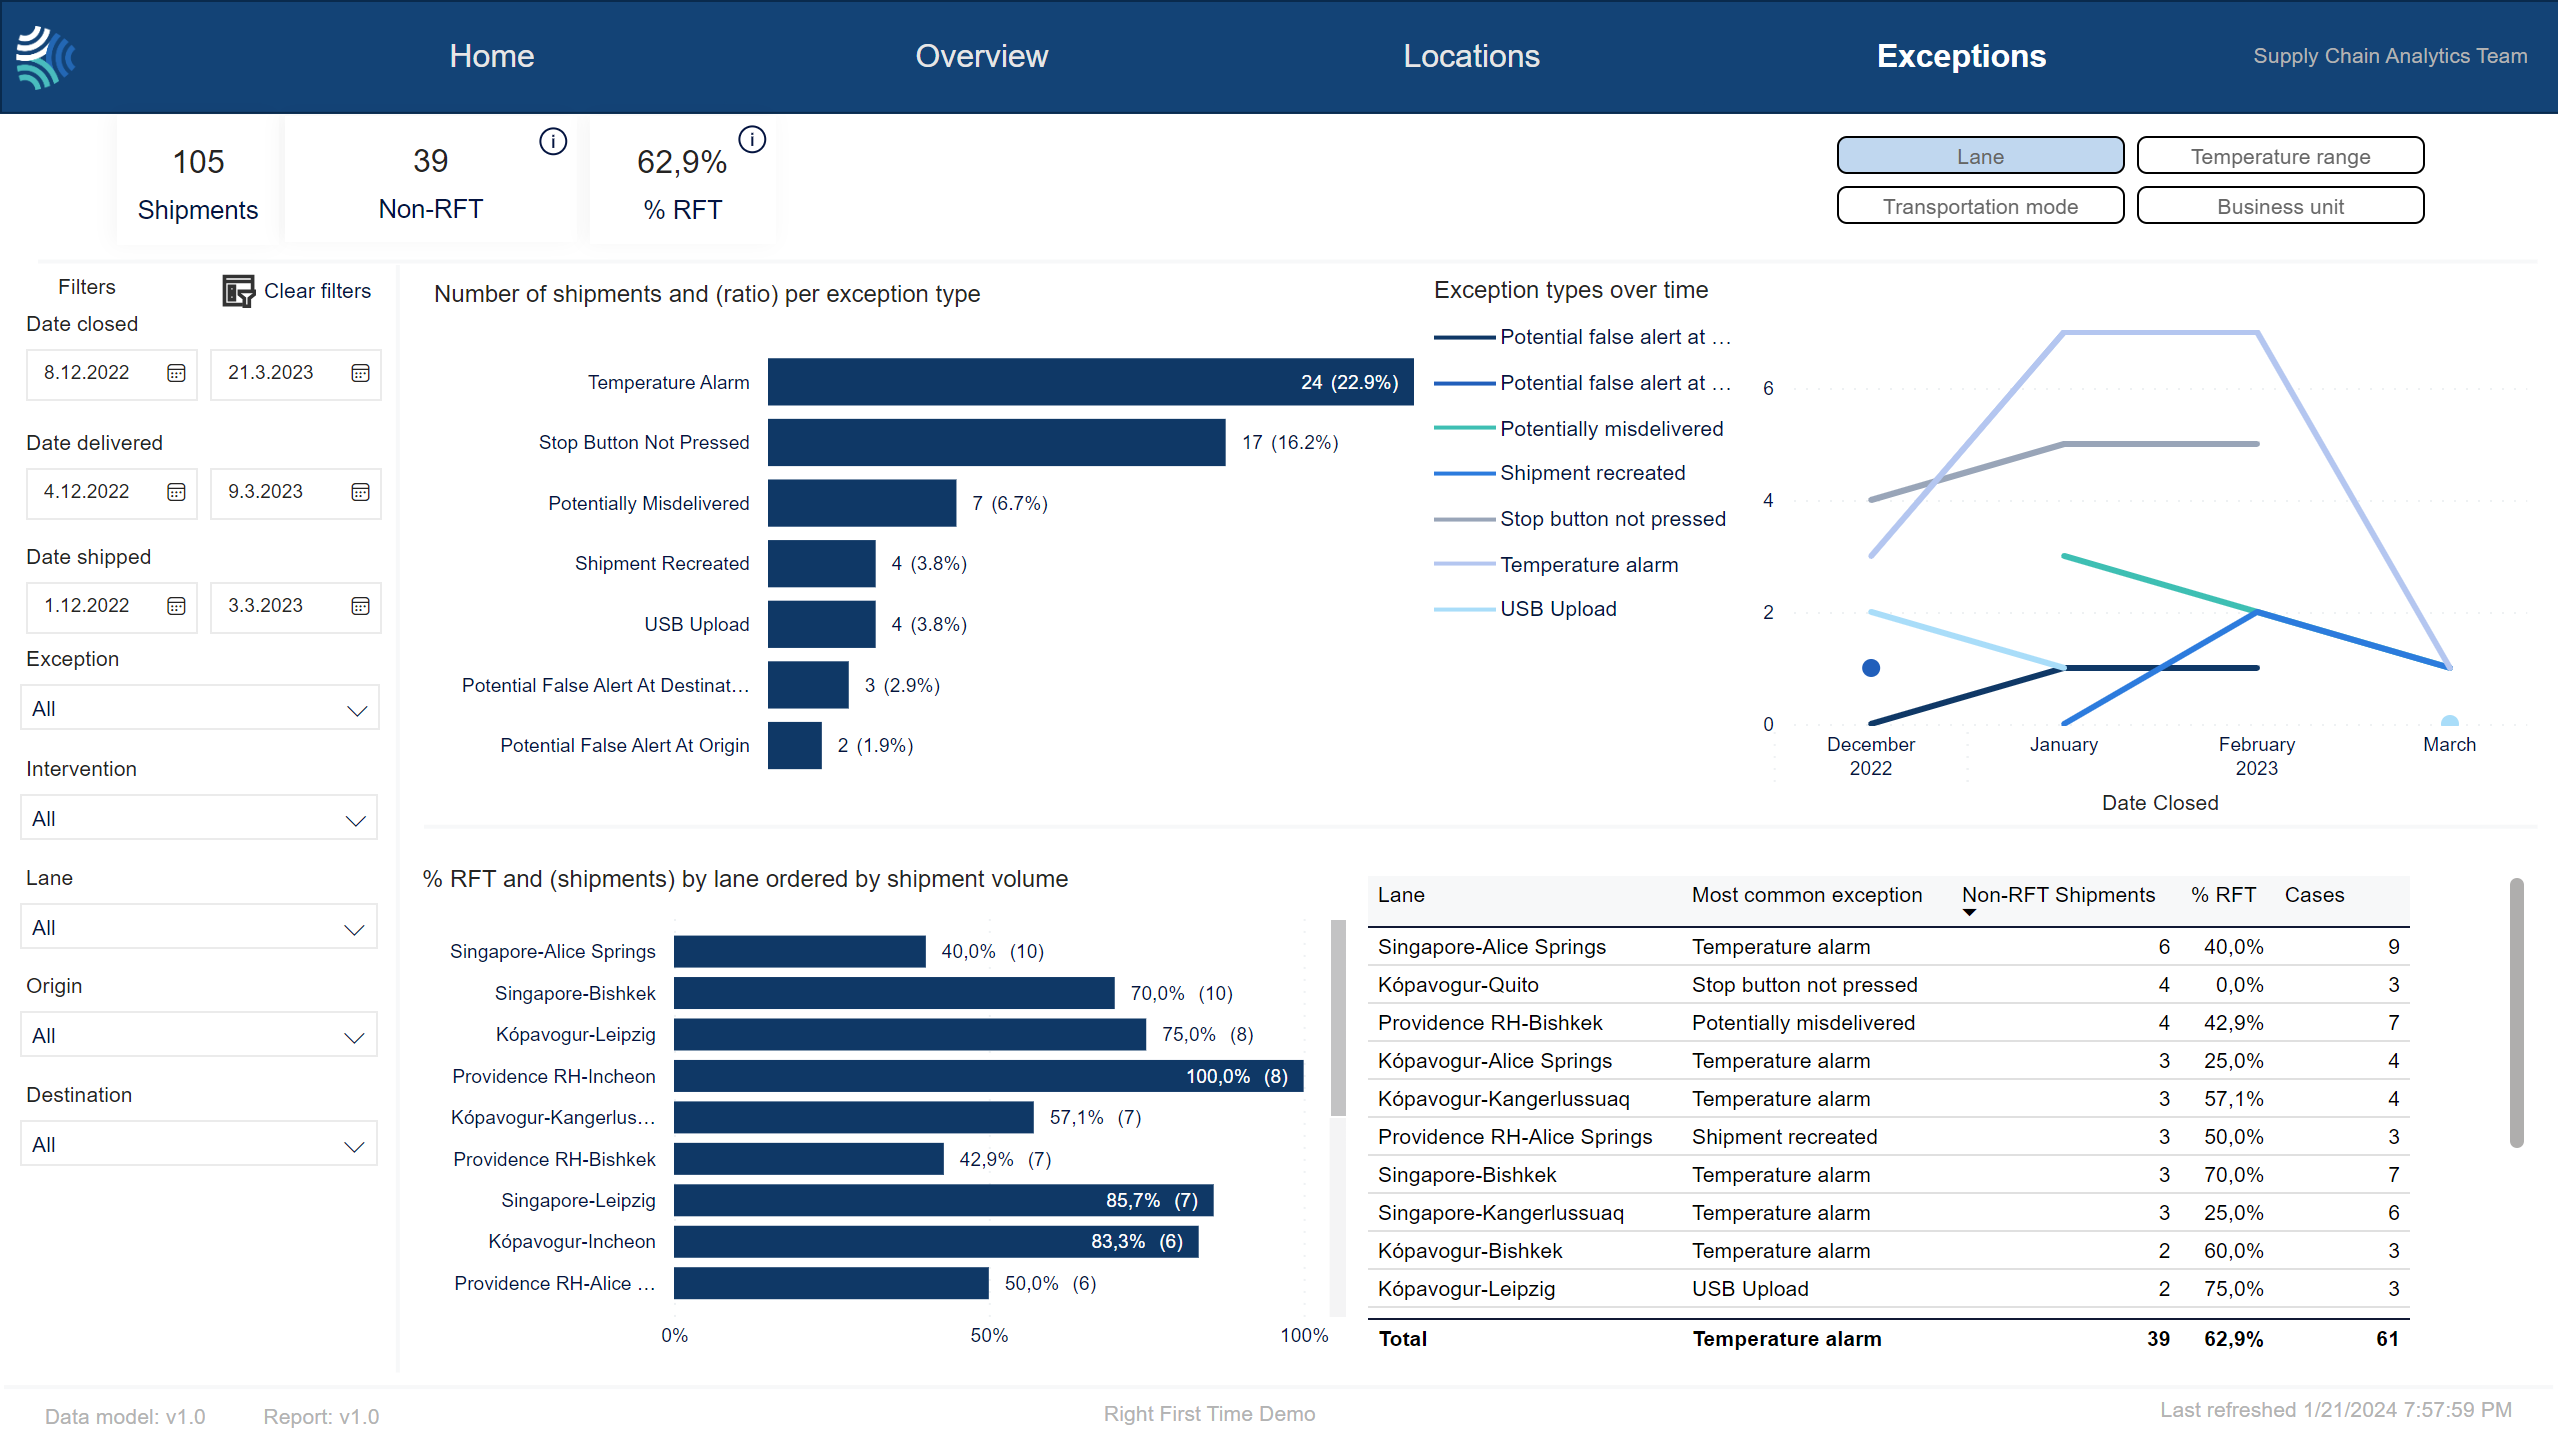
Exceptions
The Exceptions page shows a deeper dive into the different Right First Time exceptions and where they occur, by:
lane (origin - destination)
temperature range
transportation mode
business unit
Premium only
Parts of this feature are only available in the Premium version of the dashboard. For more information, please contact your Customer Success Manager.
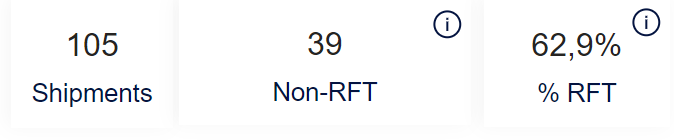
Key performance indicators for selected shipments.
Item | Description |
|---|---|
Shipments | Number of shipments closed in the selected period. The default period is 1 January 2023 – present. |
Non-RFT | Number of shipments that are Non-RFT in the selected period. |
% RFT | Ratio of RFT shipments out of the total number of shipments closed in the selected period. |
Note
Not all customers have the same filters. You may not see all of the following filters, or you may have filters not shown here.
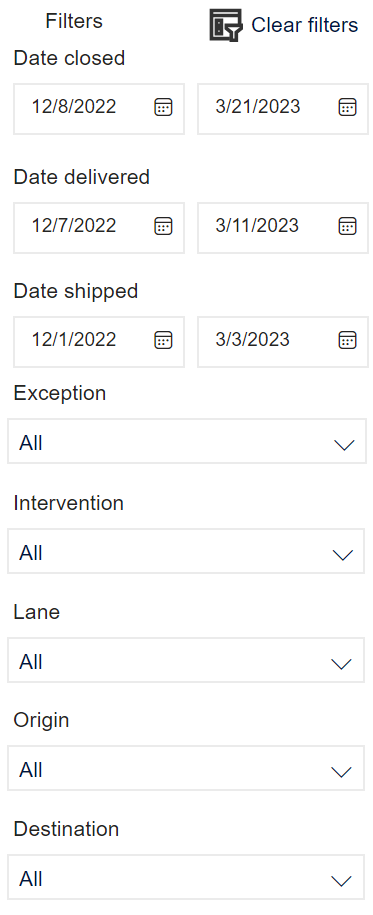
You can use the filter to select shipment data to include in the dashboard using the following criteria:
Note
For each filter, the list that appears will only include items that are present in the selected shipments.
Note
To clear all filters, click  .
.
Item | Description |
|---|---|
Date closed | Date range for the date shipment was closed, in Type a date, or click
|
Date delivered | Date range for the date shipment was delivered, in Type a date, or click
|
Date shipped | Date range for the date shipment was shipped, in Type a date, or click
|
Exception | Exception that occurred during shipment. Click to select, or press CTRL and click to select more than one of the following: |
Intervention | Intervention that occurred during shipment. Click to select, or press CTRL and click to select more than one of the following: |
Lane | Lane of shipment. The origin-destination lane of the shipment. Click to select, or press CTRL and click to select more than one from the list. |
Origin | Origin country/ site of shipment. Click to select, or press CTRL and click to select more than one from the list. |
Destination | Destination country/ site of shipment. Click to select, or press CTRL and click to select more than one from the list. |

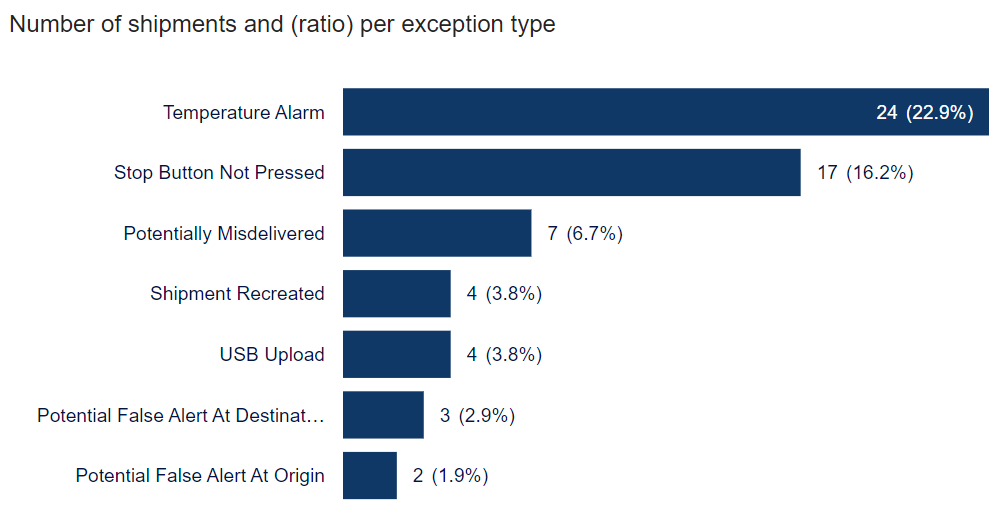
Number of shipments and ratio of exceptions by exception type. The bar size indicates the number of shipments with this exception. The numbers indicate the number of shipments with this exception, and in parentheses is the ratio of shipments with this exception.
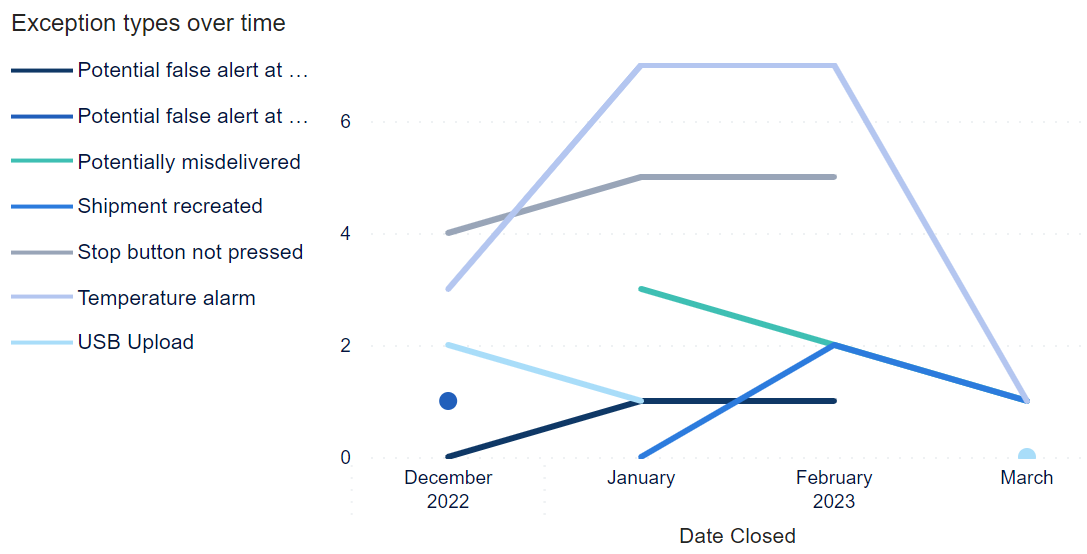
Trend of exception types over time.
To see details about exceptions for lanes, click Lane.

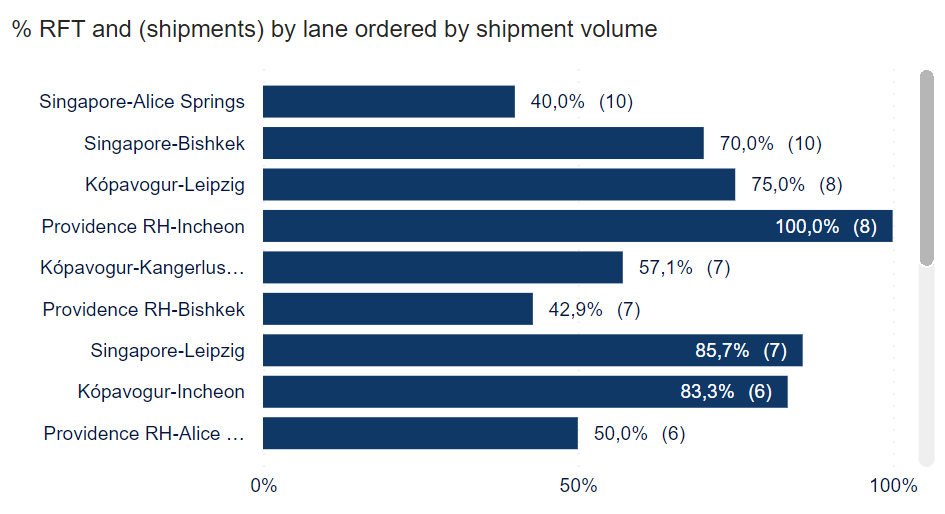
Number of shipments and ratio of exceptions by exception type:
x%- Ratio of RFT shipments on this lane.(x)- Number of shipments on this lane for the selected period.
Note
You can click a lane to filter the shipments shown in Most common exceptions by lane.
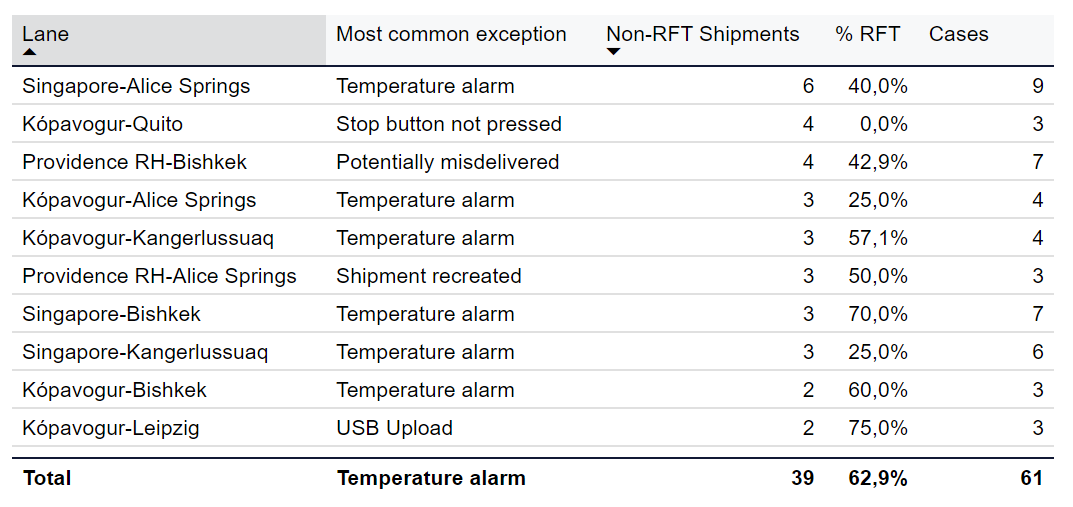
Most common exceptions by lane.
Note
You can click a lane in the % RFT and (shipments) by lane ordered by shipment volume graph to filter the shipments selected.
Item | Description |
|---|---|
Lane | Lane of shipment. Origin-destination of shipment. |
Most common exception | Most common exception for this lane. One of the following: |
Non-RFT shipments | Number of shipments considered Non-RFT for this lane. |
% RFT | Ratio of shipments considered RFT for this lane. |
Cases | Number of instances of exceptions in selected shipments. |
To see details about exceptions for different temperature range configurations, click Temperature range.

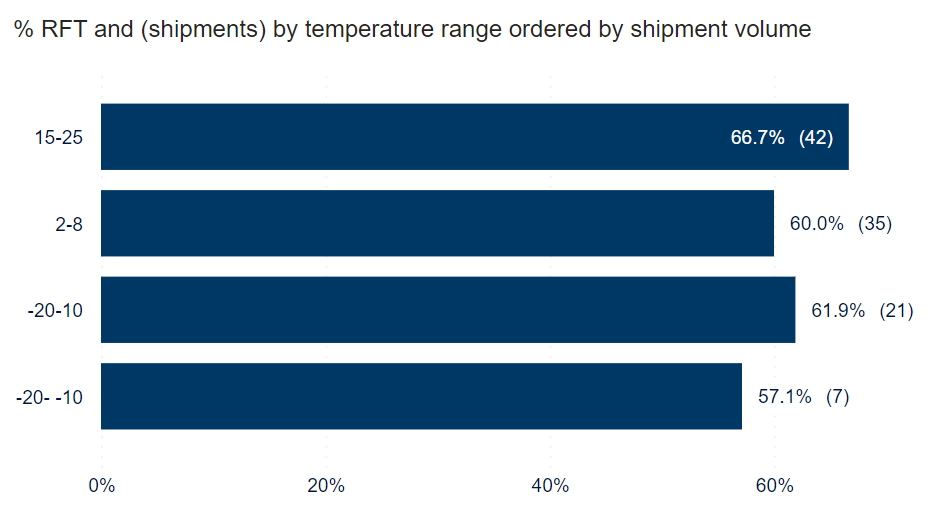
Number of shipments and ratio of exceptions by temperature range:
x%- Ratio of RFT shipments in this temperature range.(x)- Number of shipments in this temperature range.
Note
You can click a temperature range to filter the shipments shown in Most common exceptions by temperature range.
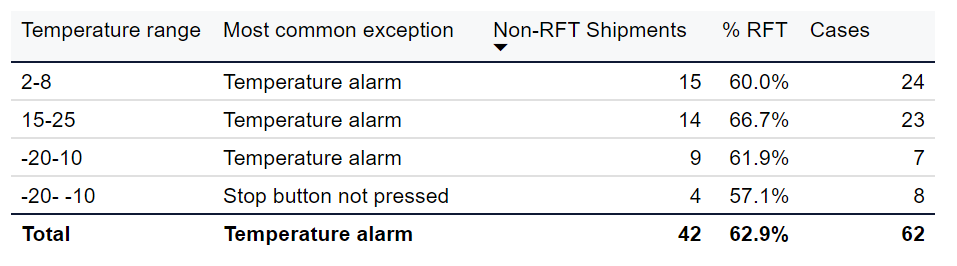
Most common exceptions by temperature range.
Note
You can click a temperature range in the % RFT and (shipments) by temperature range ordered by shipment volume graph to filter the shipments selected.
Item | Description |
|---|---|
Temperature range | Temperature range configuration. |
Most common exception | Most common exception for this temperature range. One of the following: |
Non-RFT shipments | Number of shipments considered Non-RFT for this temperature range. |
% RFT | Ratio of shipments considered RFT for this temperature range. |
Cases | Number of instances of exceptions in selected shipments. |
Note
The sections Business unit and Transportation mode are available only if you have made information about business unit and mode of transportation available in Supply Chain Monitoring.
To see details about exceptions for different transportation modes, click Transportation mode.

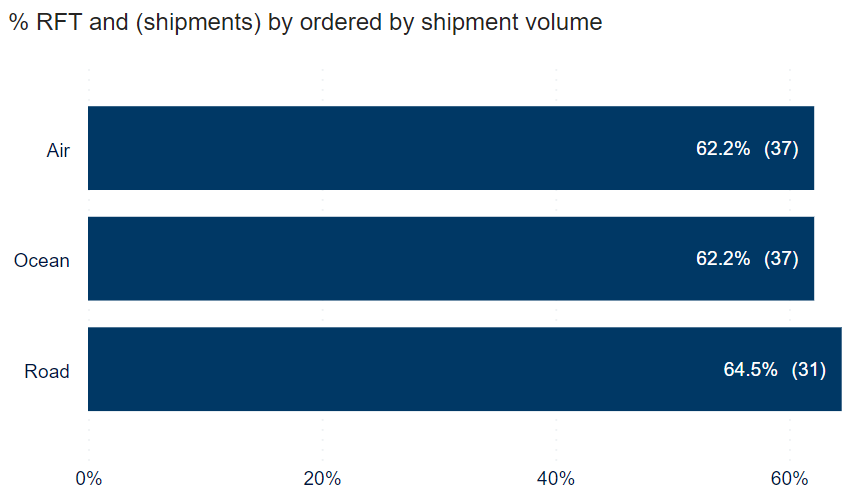
Number of shipments and ratio of exceptions by transportation mode. Options can be added by customer, but typically include:
Note
You can click a transportation mode to filter the shipments shown in Most common exceptions by transportation mode.
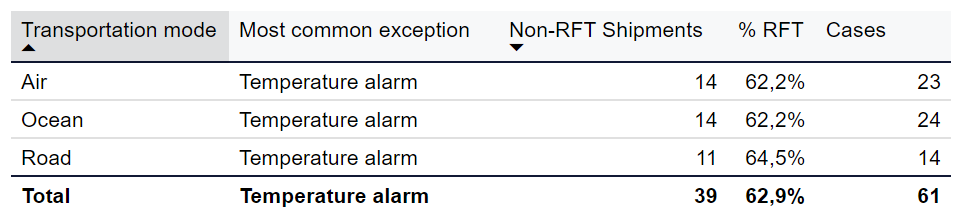
Most common exceptions by transportation mode.
Note
You can click a transportation mode in the % RFT and (shipments) ordered by transportation mode graph to filter the shipments selected.
Item | Description |
|---|---|
Transportation mode | Mode of transportation of shipment. Options can be added by customer, but typically include: |
Most common exception | Most common exception for this transportation mode. One of the following: |
Non-RFT shipments | Number of shipments considered Non-RFT for this transportation mode. |
% RFT | Ratio of shipments considered RFT for this transportation mode. |
Cases | Number of instances of exceptions in selected shipments. |
Note
The sections Business unit and Transportation mode are available only if you have made information about business unit and mode of transportation available in Supply Chain Monitoring.
To see details about exceptions for different business units, click Business unit.

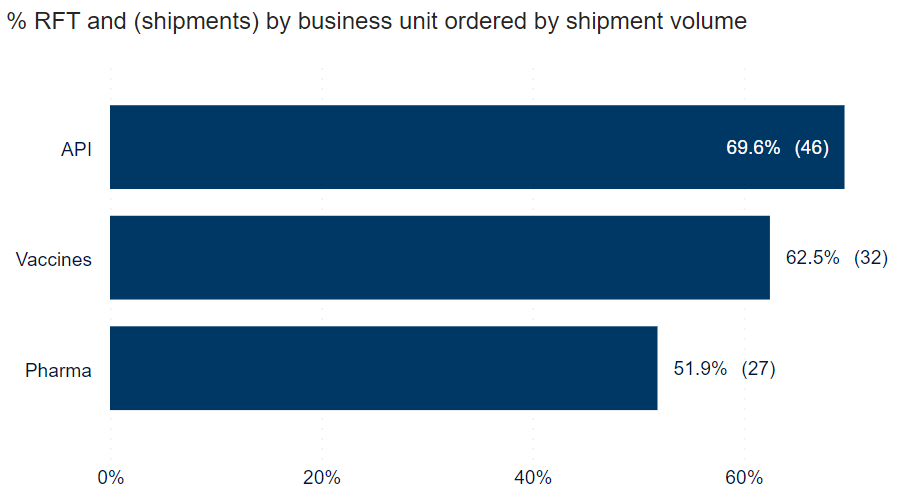
Number of shipments and ratio of exceptions by business unit.
Note
You can click a lane to filter the shipments shown in Most common exceptions by business unit.
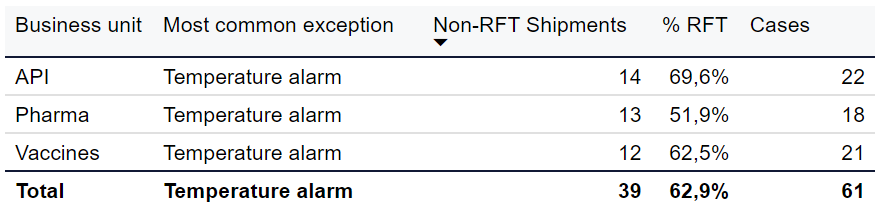
Most common exceptions by business unit.
Note
You can click a lane in the % RFT and (shipments) by lane ordered by shipment volume graph to filter the shipments selected.
Item | Description |
|---|---|
Business unit | Business unit of customer. |
Most common exception | Most common exception for this business unit. One of the following: |
Non-RFT shipments | Number of shipments considered Non-RFT for this business unit. |
% RFT | Ratio of shipments considered RFT for this business unit. |
Cases | Number of instances of exceptions in selected shipments. |