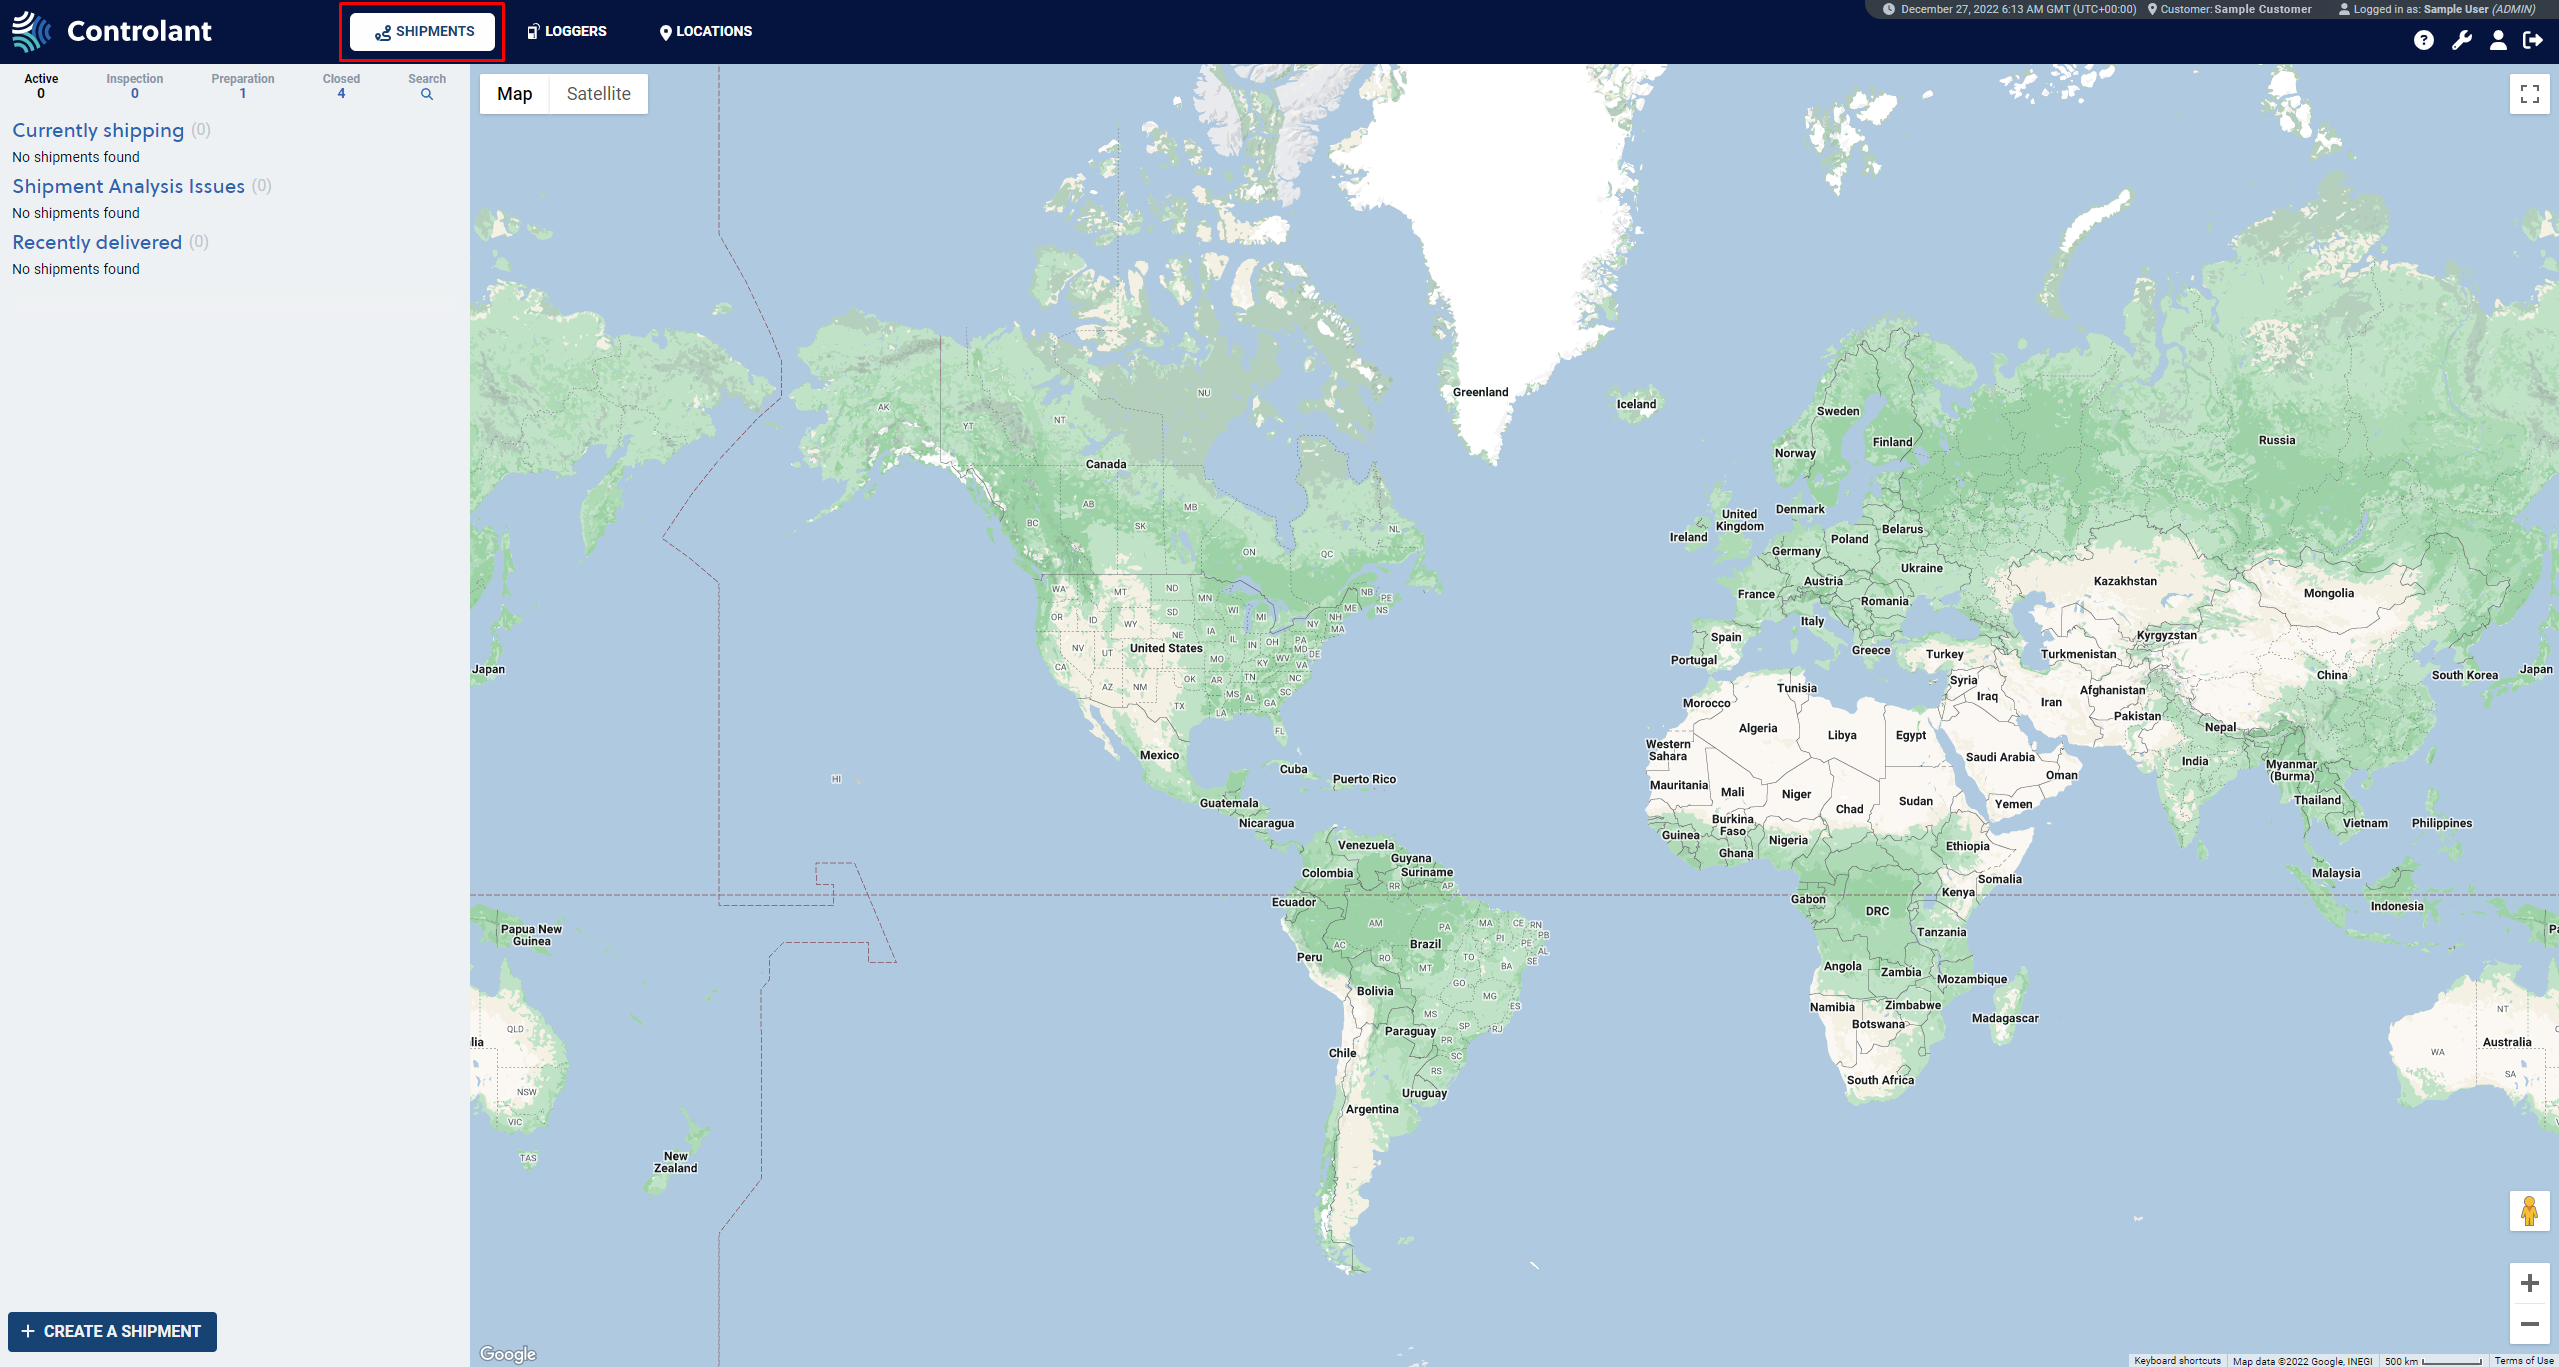
Shipments view
Note
This is a premium feature. For more information, please contact your Key Account Manager.
Note
This is a premium feature. For more information, please contact your Key Account Manager.
Shipment view
Select a single shipment in the Shipments view to reach it.
 |
The right side of the view is split into two views (if any shipment is selected). The top view has three different tabs for three different views that display shipment information, and the bottom view shows a map of the route. To see the complete top view, scroll down to the bottom.
Info tab
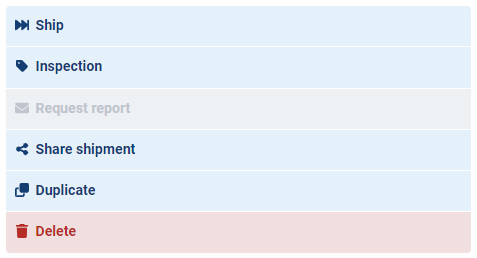
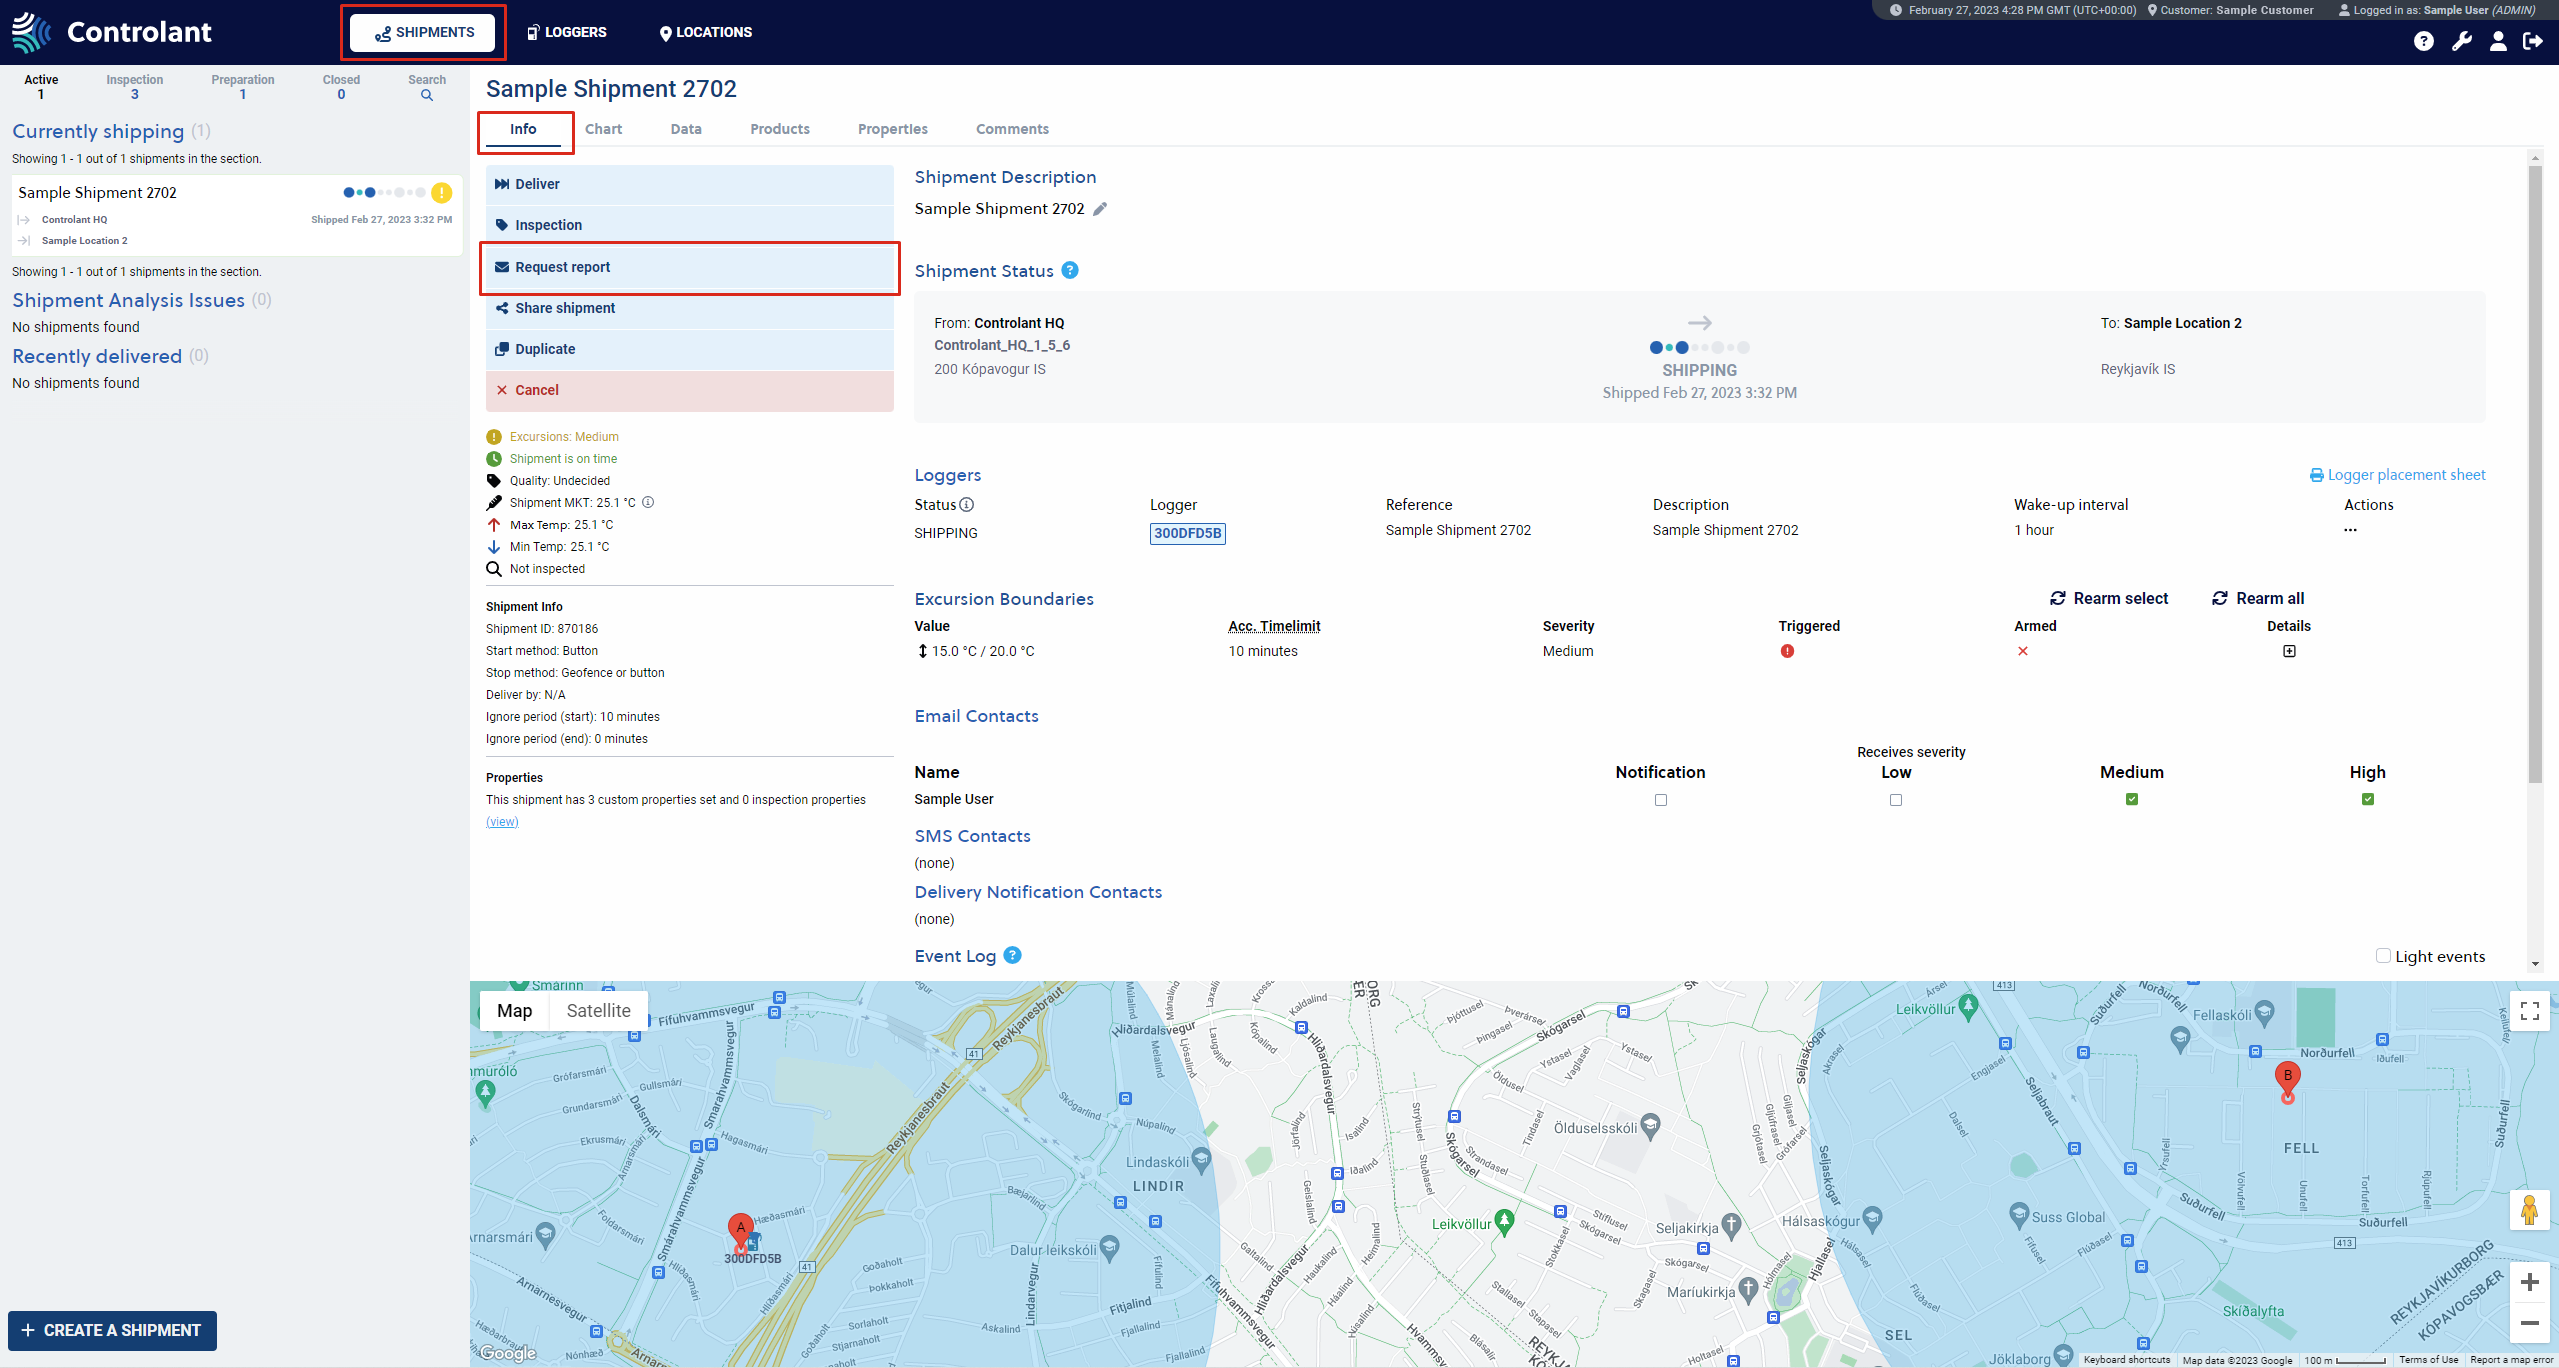
The first tab in the top view is the Info tabwhich shows shipment information and the operations you can perform on the shipment. The available operations are as shown in the image below.
 |
Under the action buttons, you can find high-level information about a shipment, including:
Excursion status: Low, Medium, High
Delivery on time: Late or on time, depending on what is set in the "Delivery by" field in shipment creation
Quality: Undecided/Good/Bad or Undecided/Released/Partially Released/Rejected
Shipment MKT: Mean Kinetic Temperature
Max and Min Temperature: the highest and lowest temperature recorded during the shipment
Inspection Status: Not Inspected/Being Inspected/Inspected
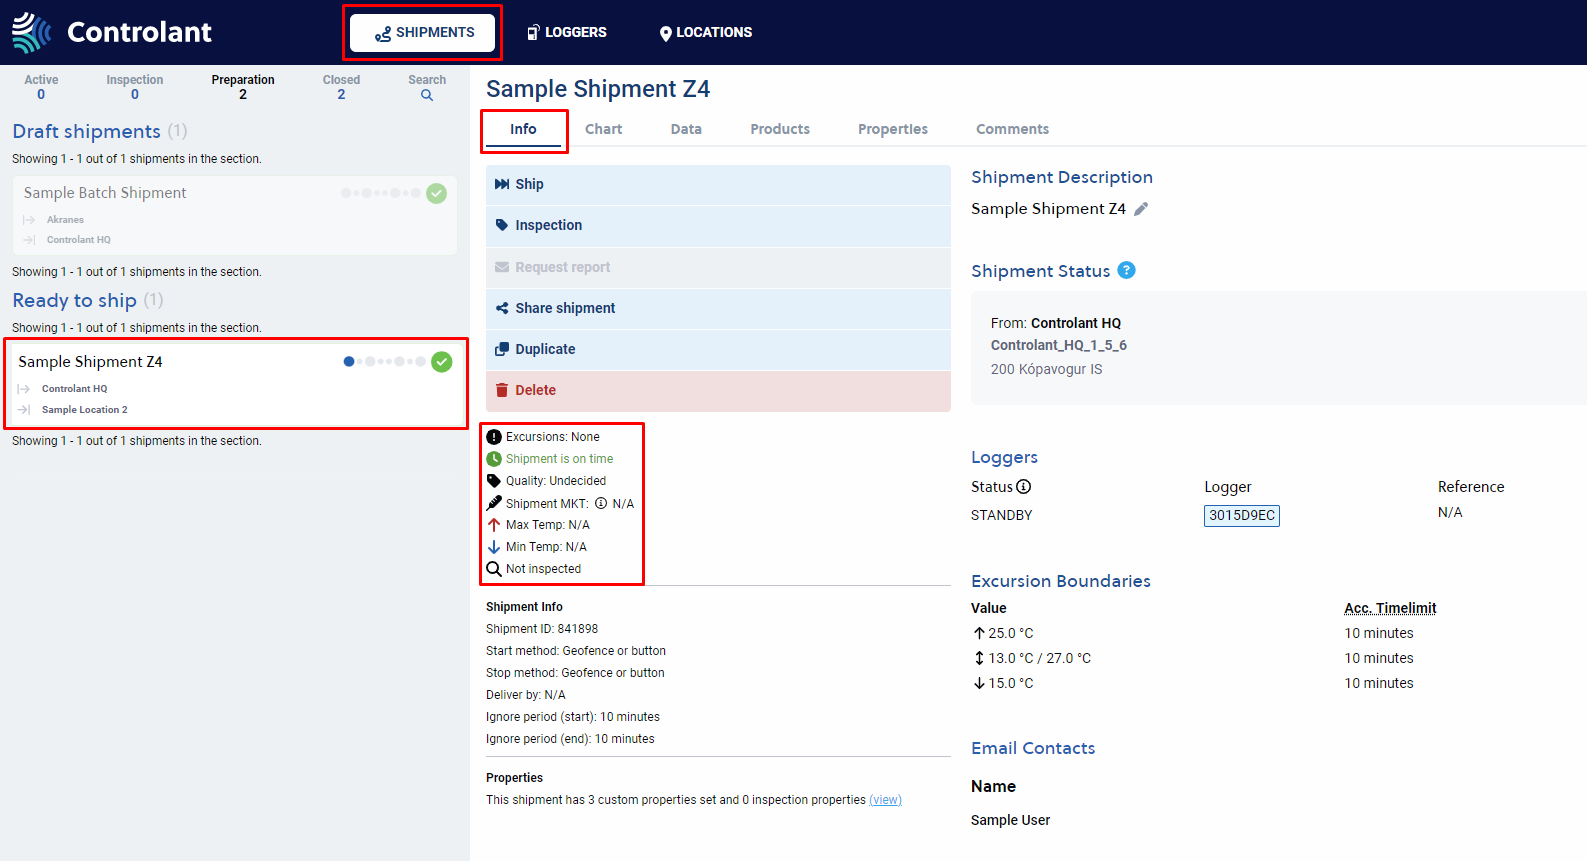 |
While in the Info tab, it is possible to edit the Shipment Description. To do this, press the Pencil icon next to the Shipment Description in the top left corner of the Info screen.
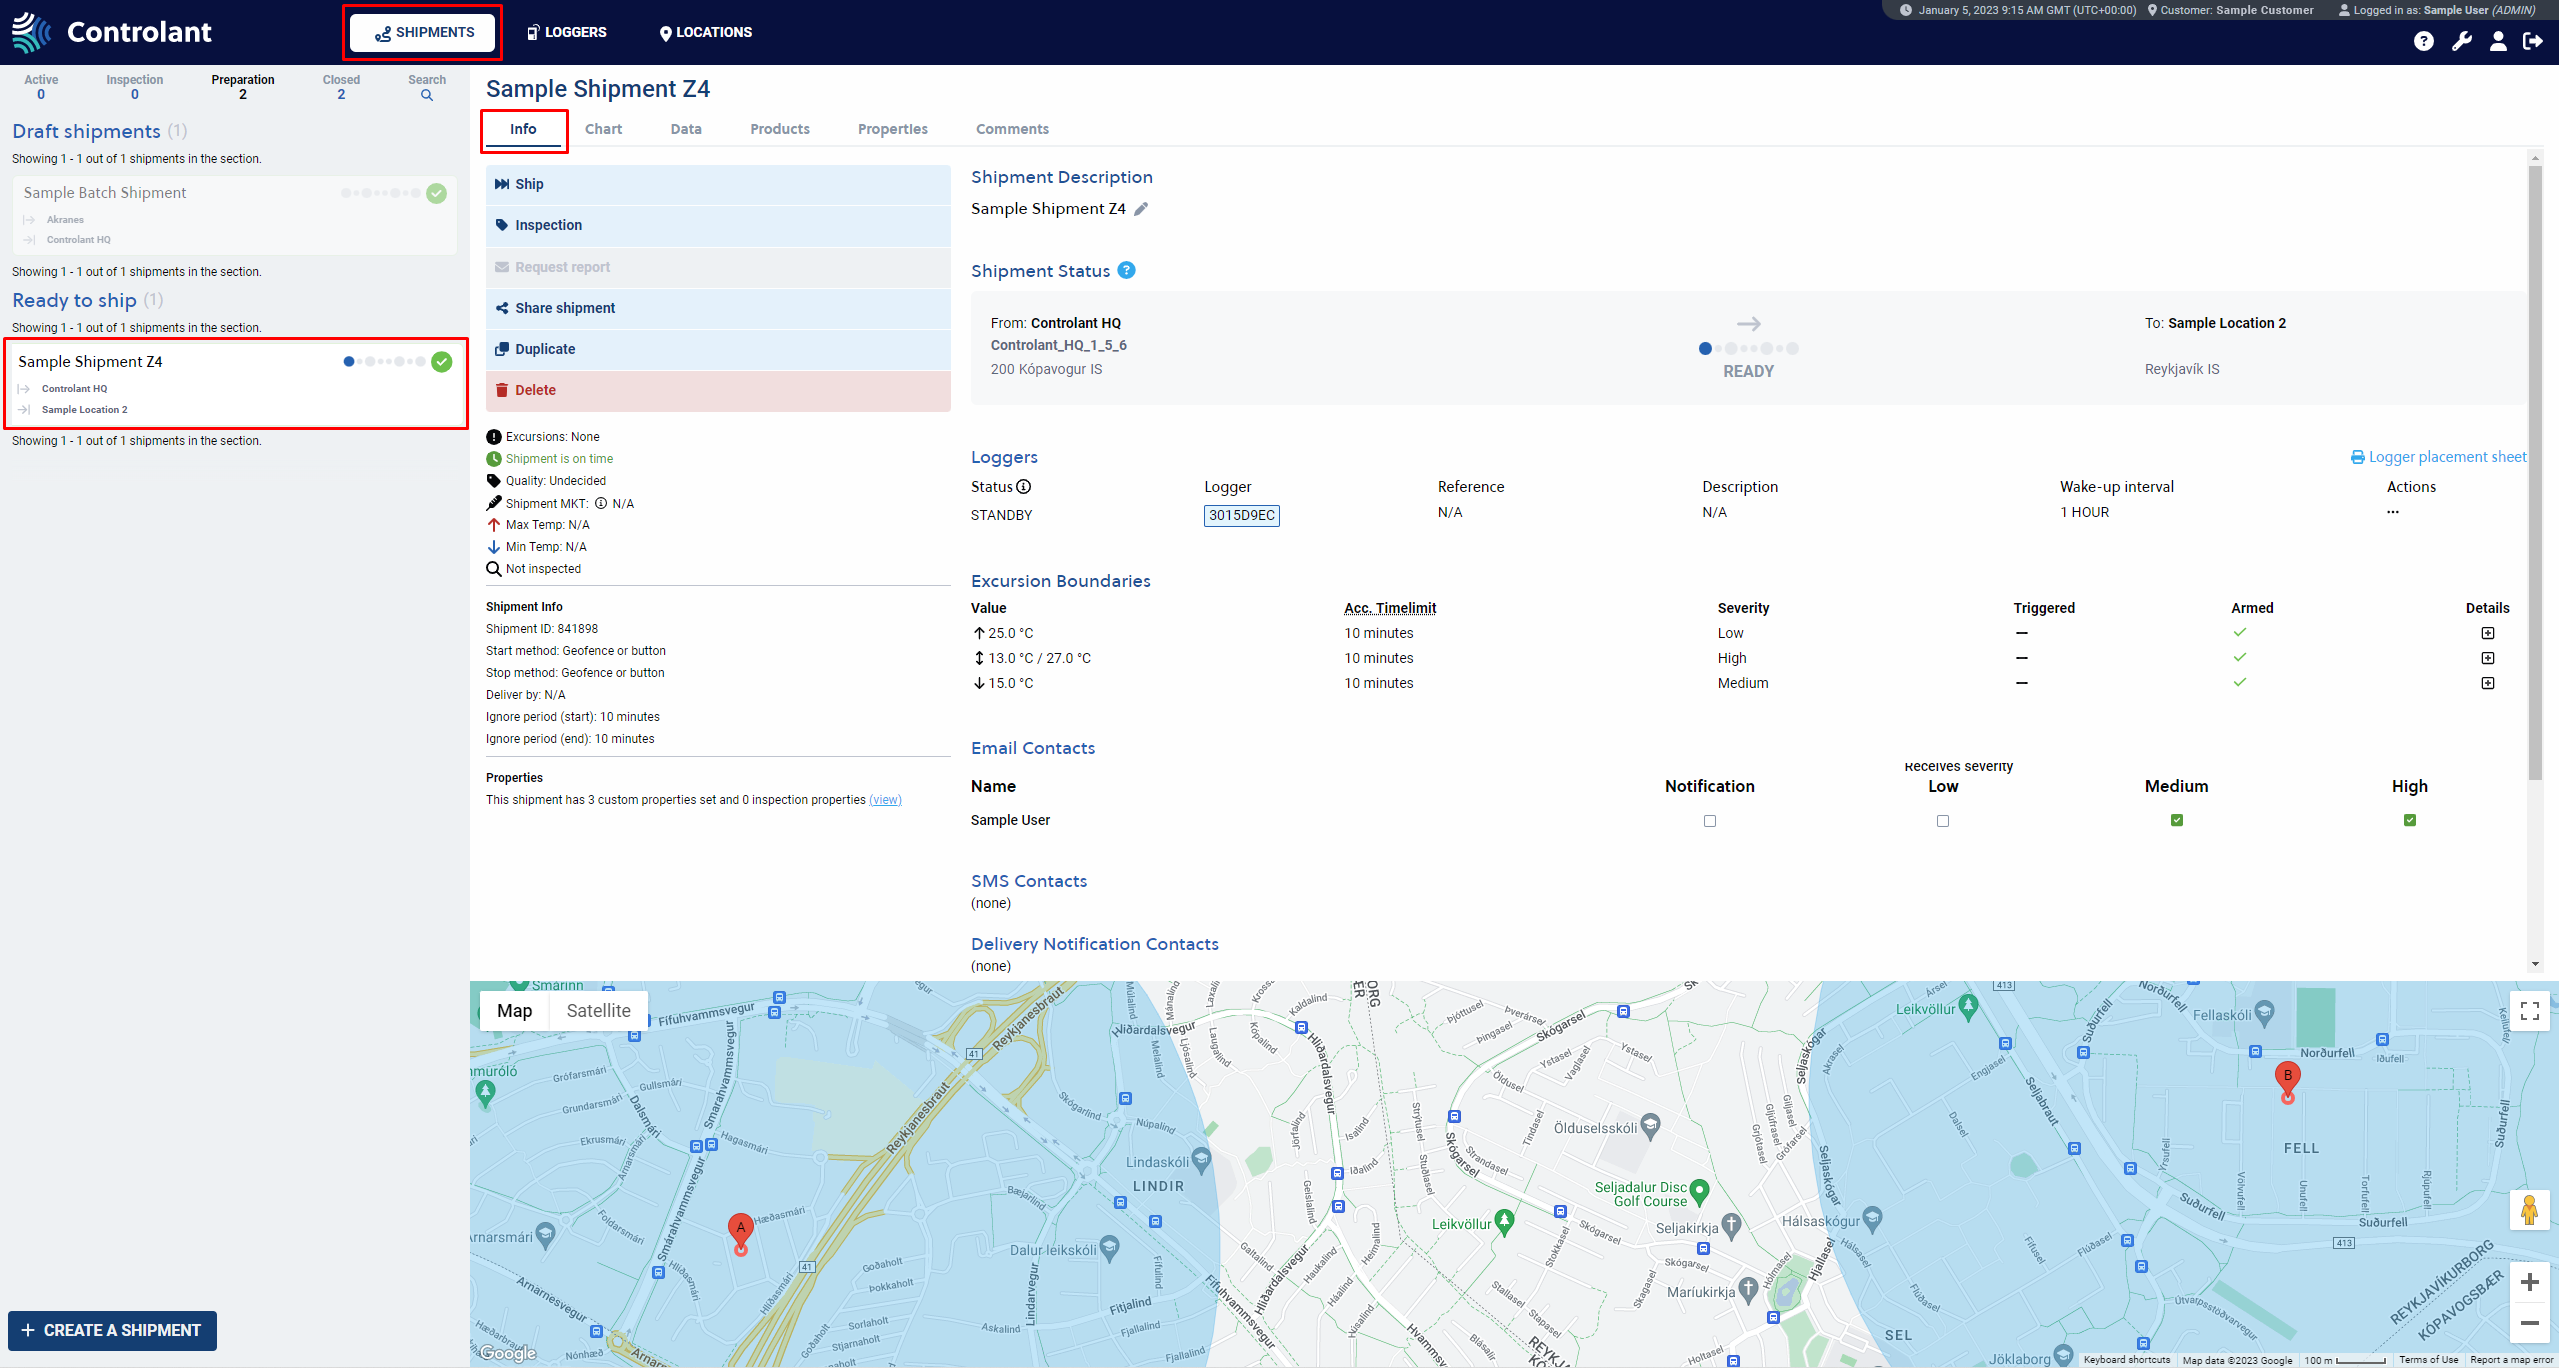 |
In the EXCURSION BOUNDARIES section, you’ll find the boundaries table, where you can see the preset temperature boundaries and their severity settings for the shipment.
By clicking on a certain boundary, you’ll see if there were any triggers and if the boundary is armed or not.
The amount of time a logger had spent outside of the preset boundaries will only appear after delivery and data analysis.
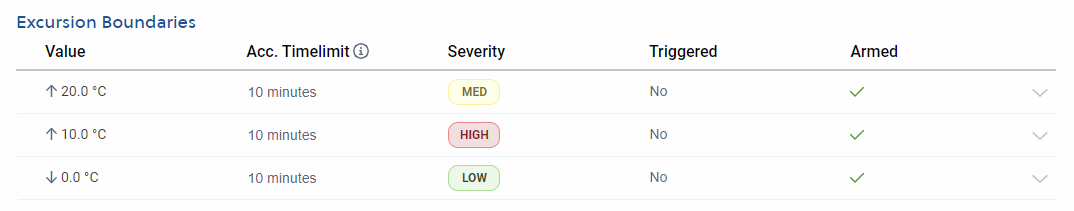
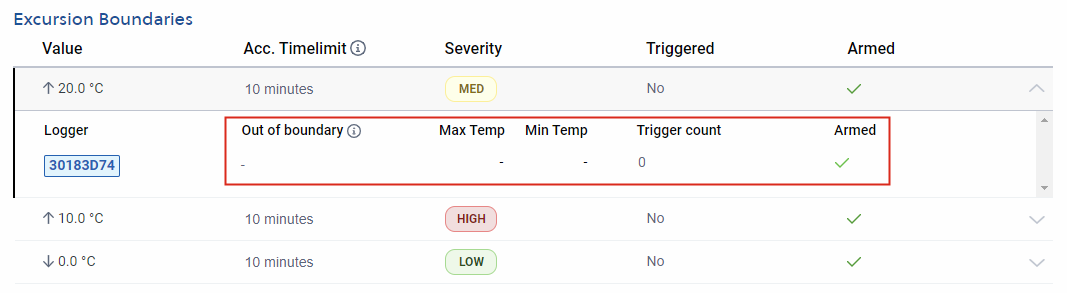
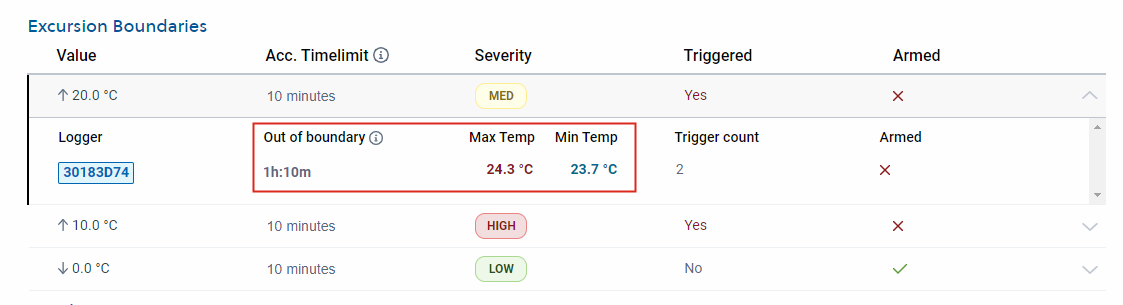
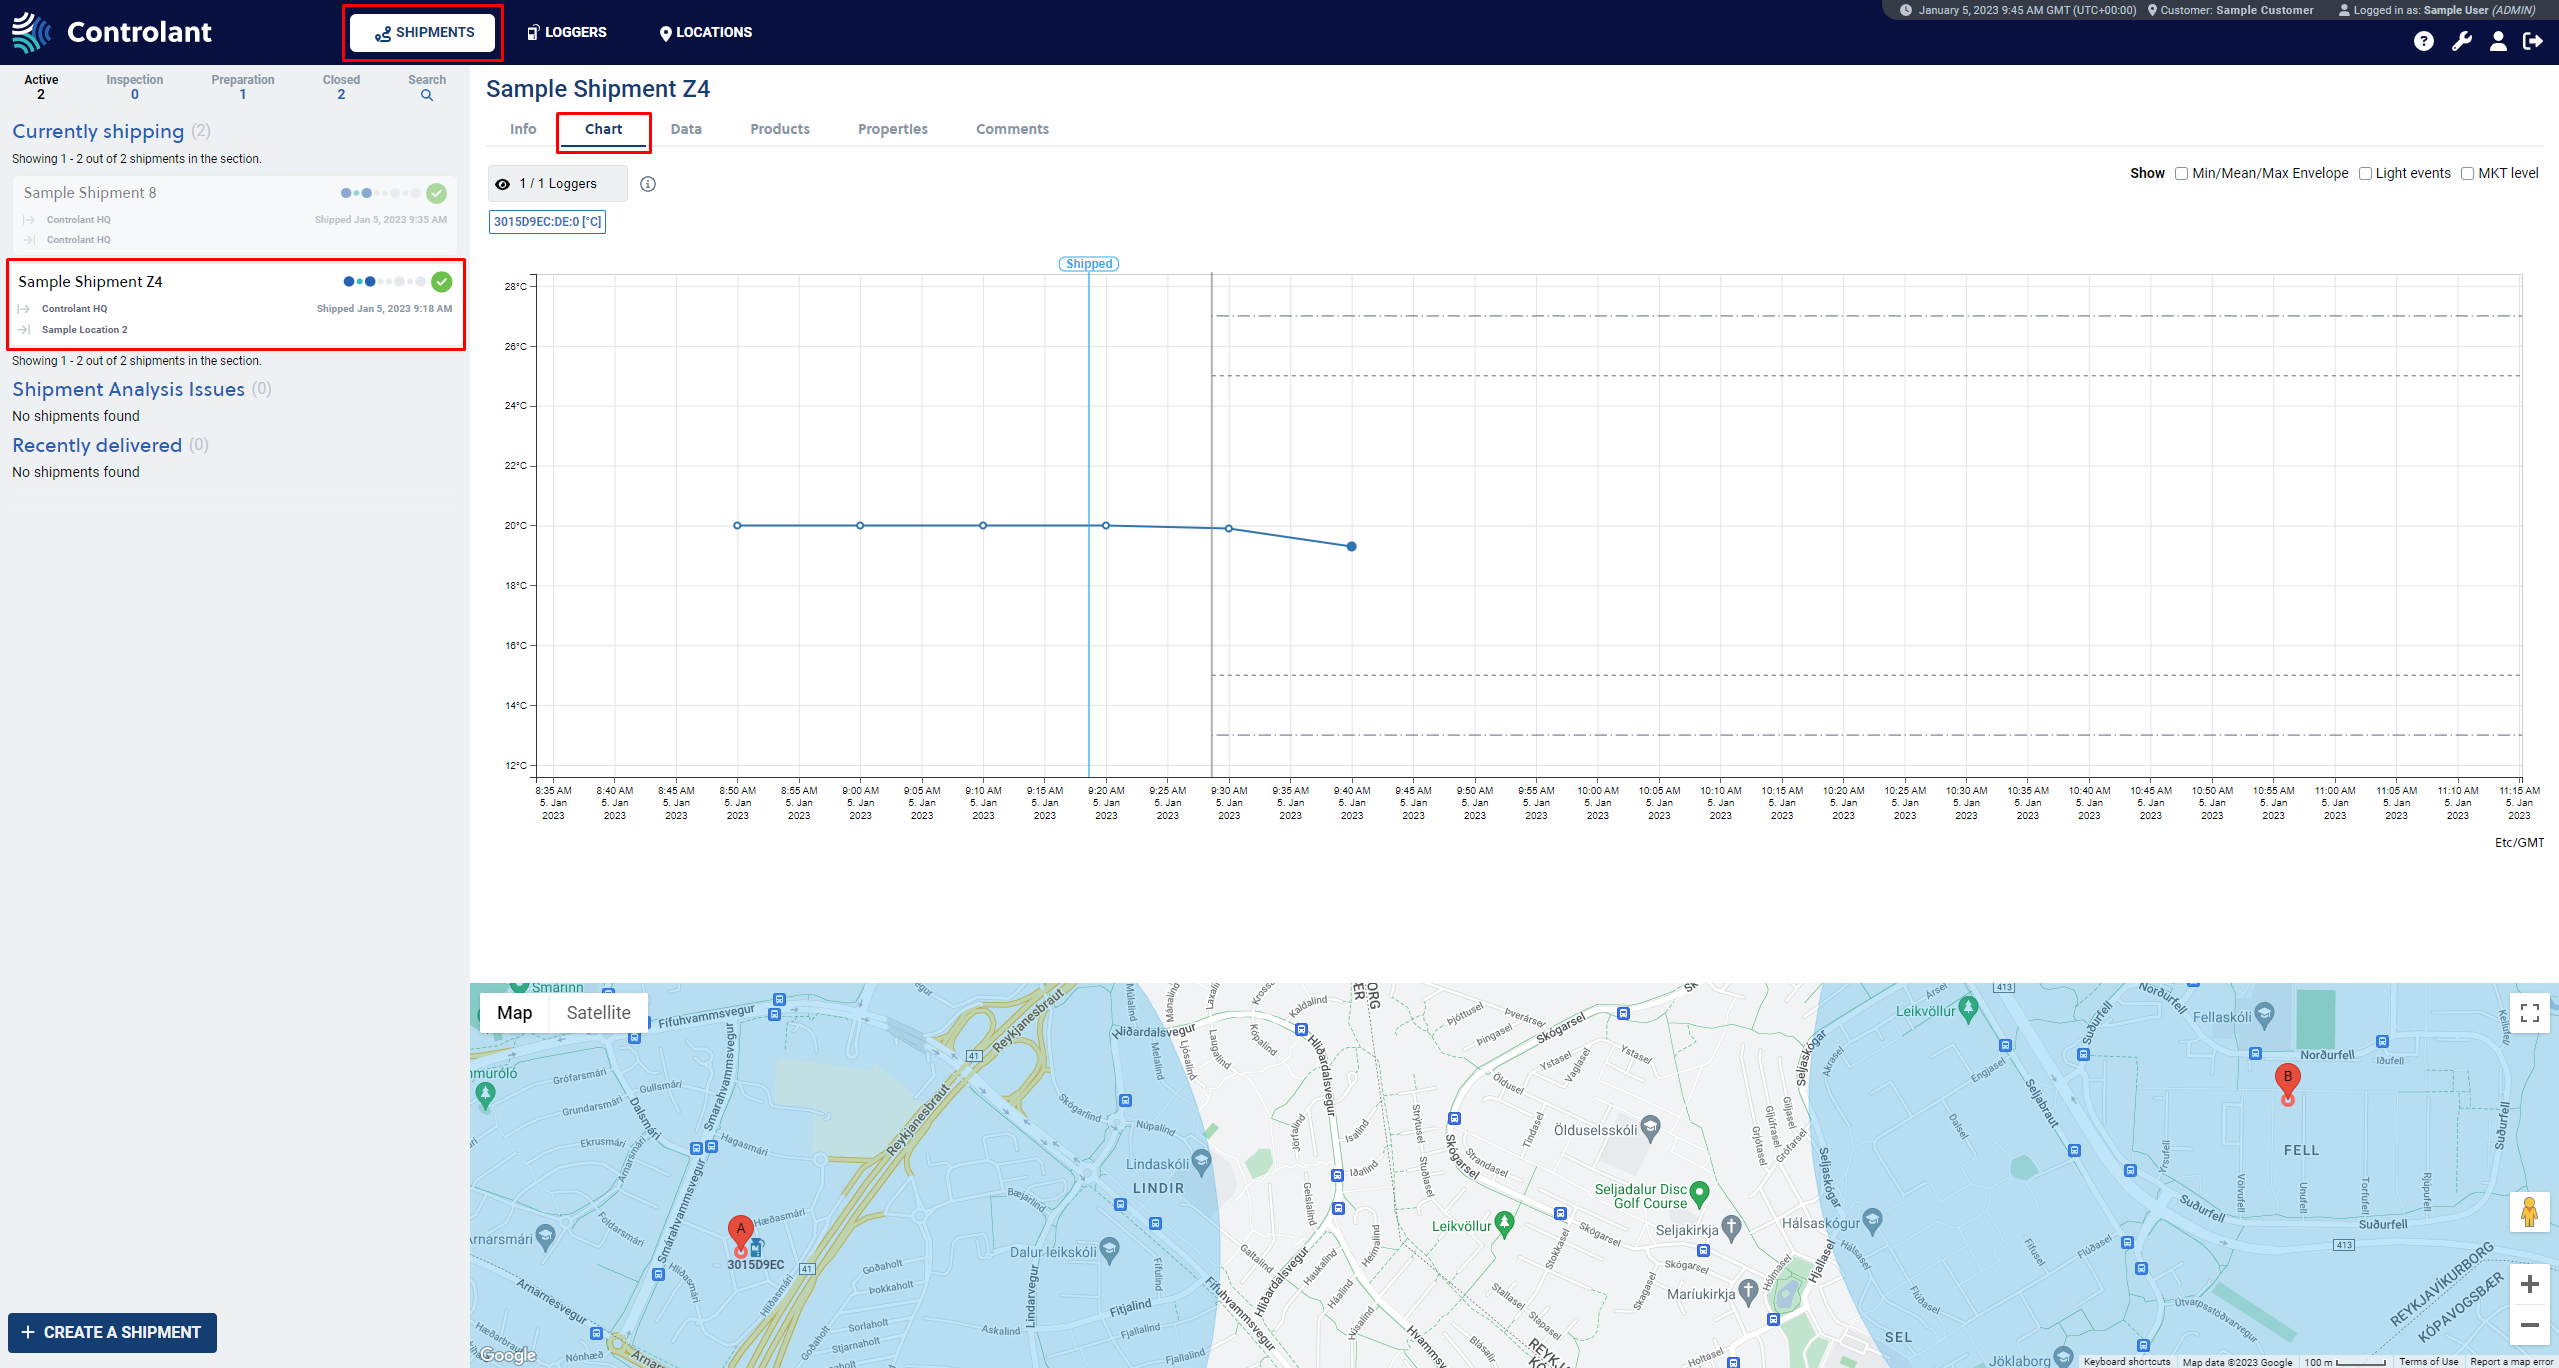
Chart tab
The Chart tab shows the shipment measurements for a logger on a time series chart. Click here to read about the Chart tab in more detail.
 |
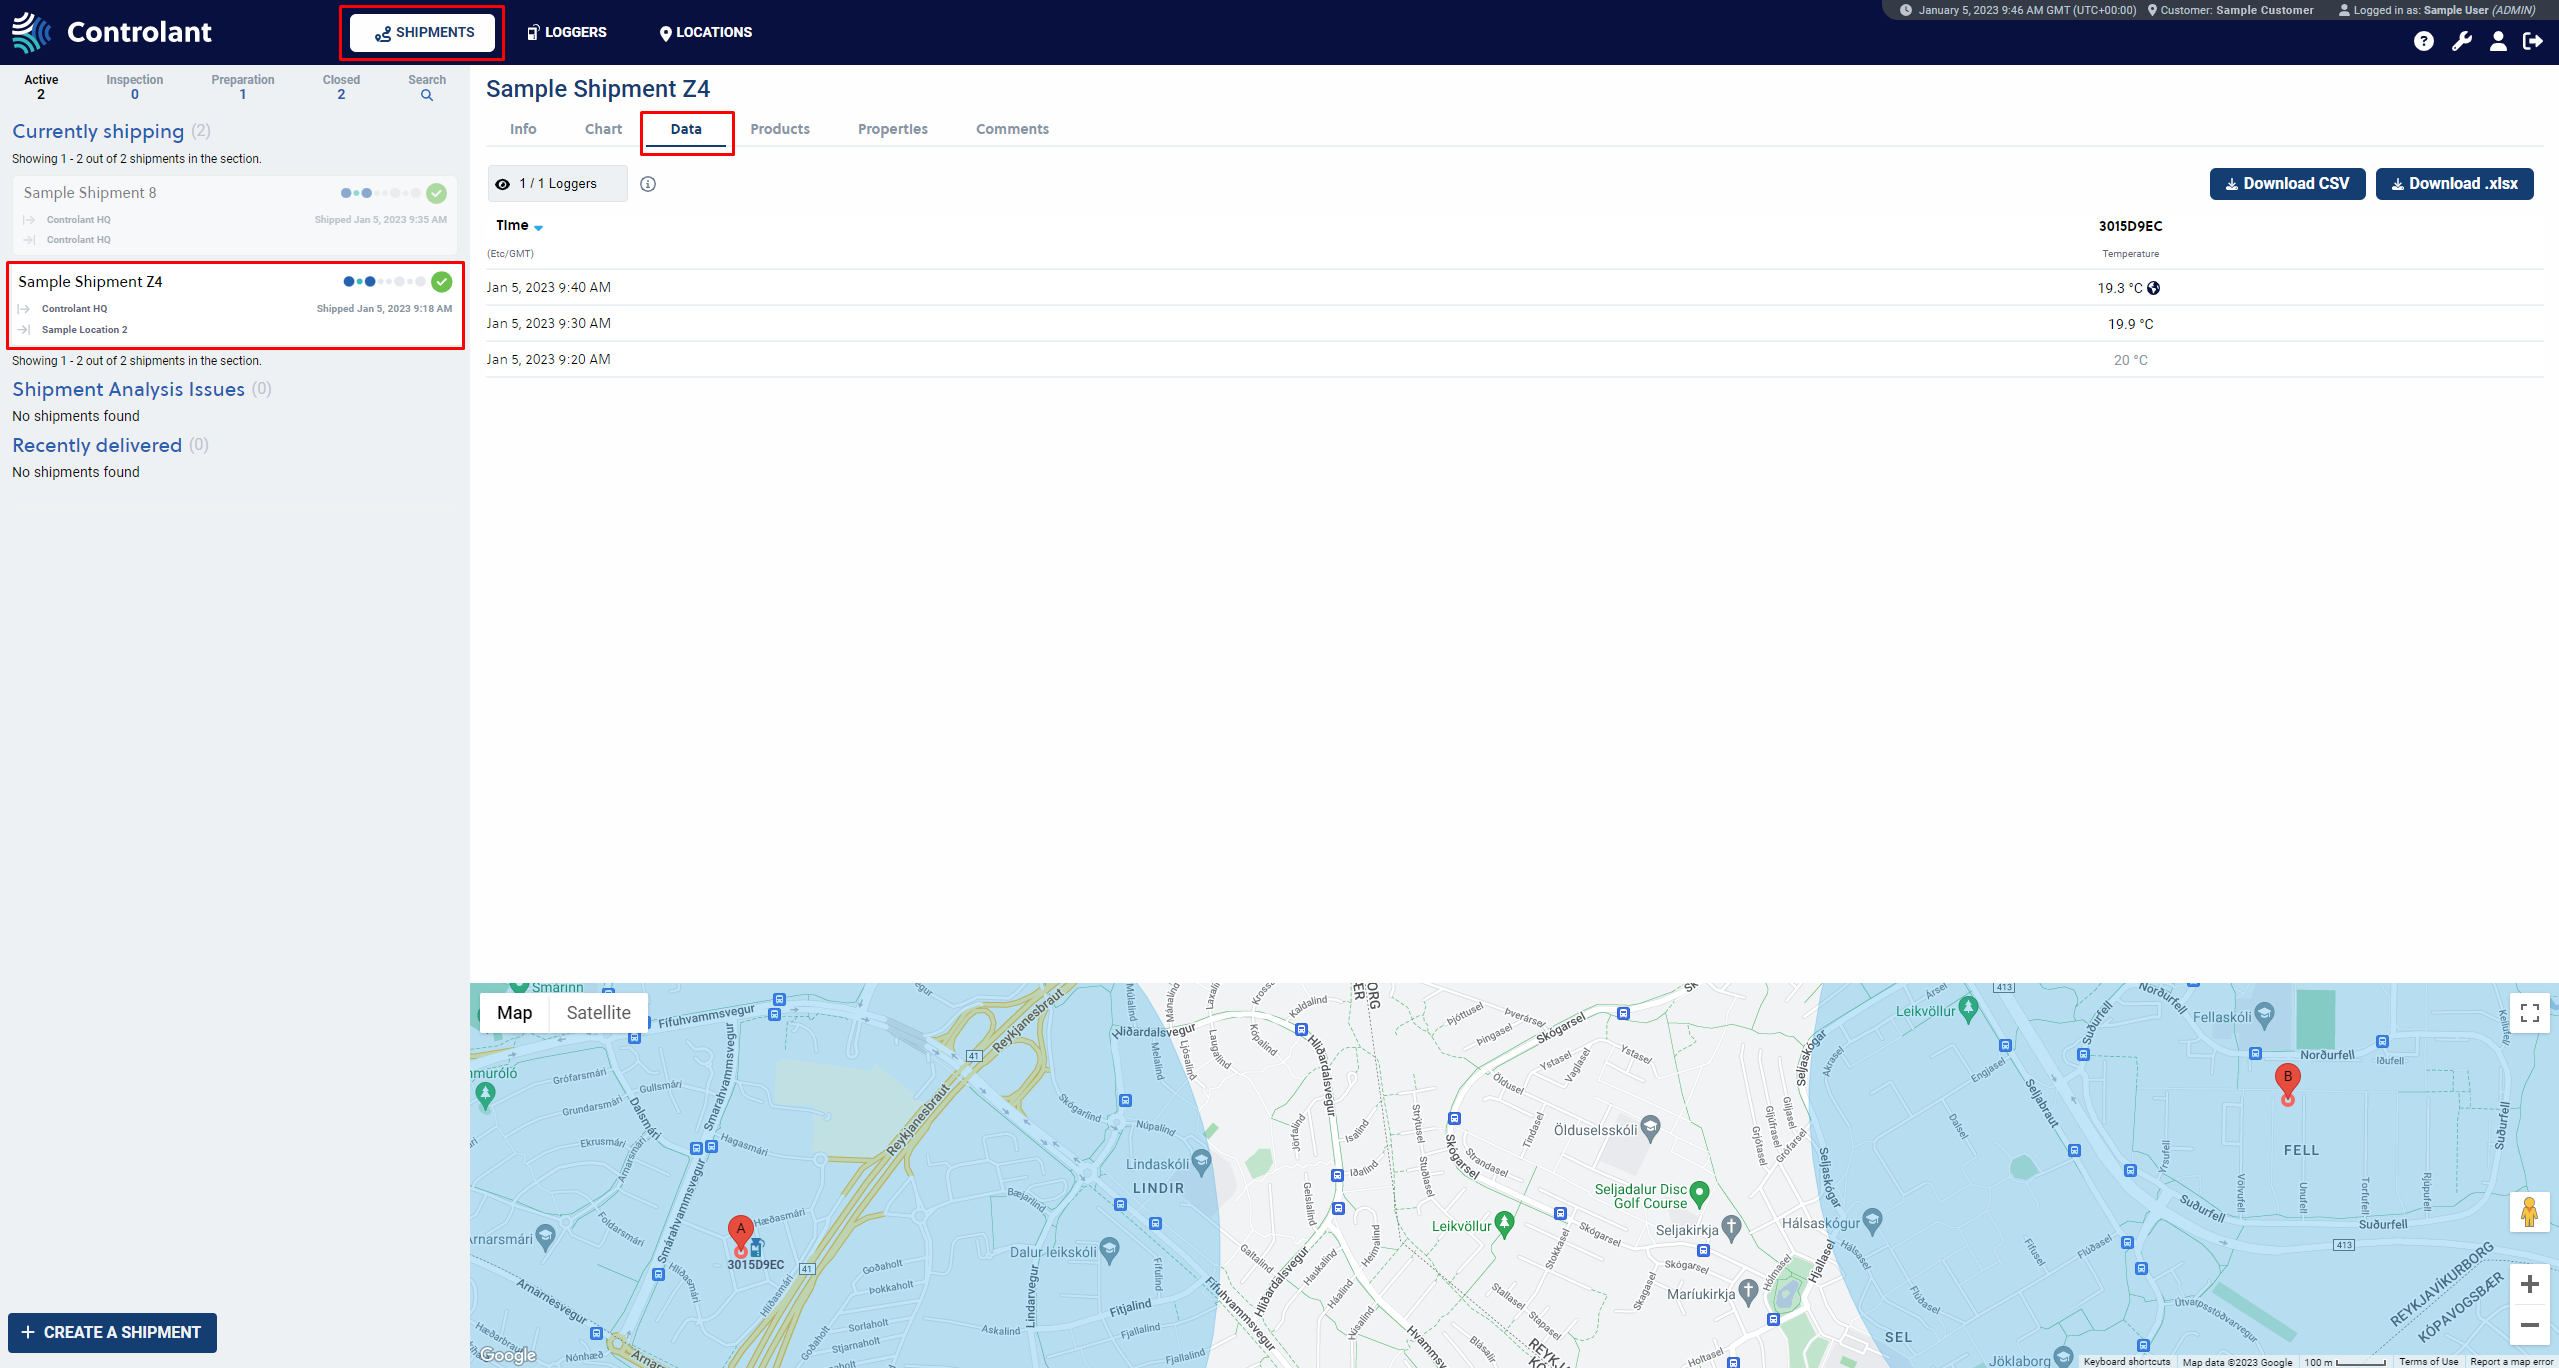
Data tab
The Data tab shows the shipment measurements for the selected logger(s) in a tabular format. Go here to read about the Data tab in more detail.
 |
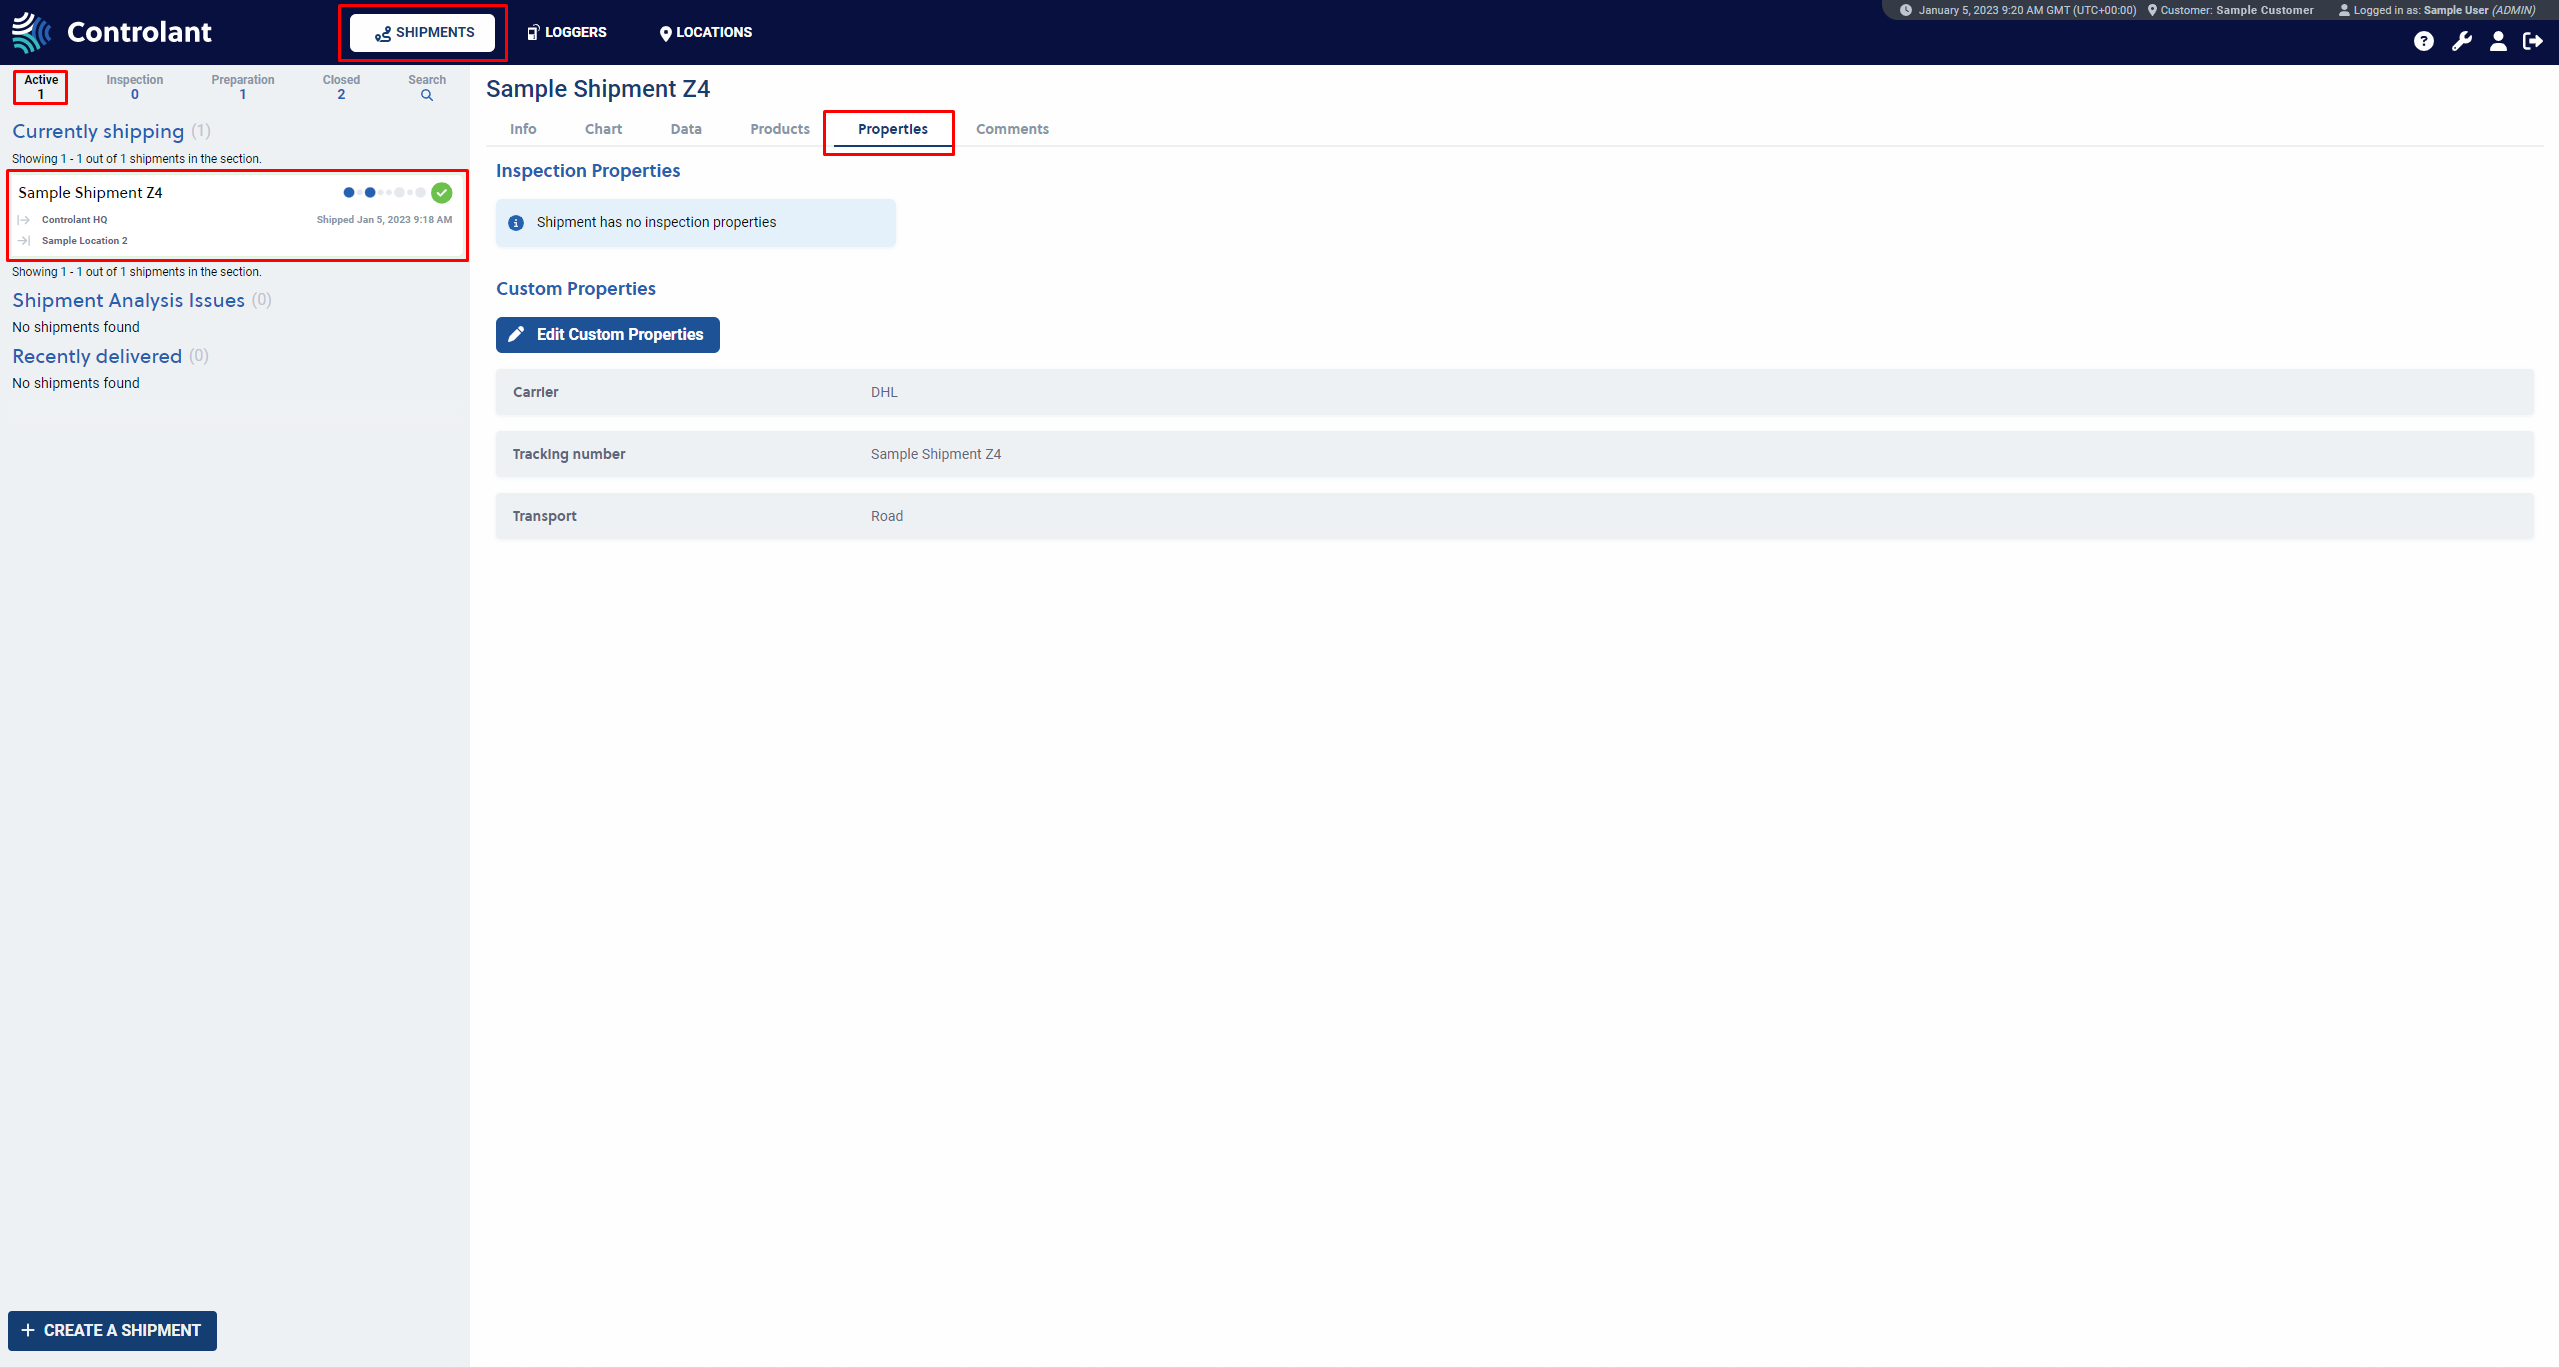
Properties tab
The Properties tab shows the list of properties and their value(s) added to the shipment.
 |
Shipment actions
You can perform different operations on the shipment depending on the state that it is in. If the shipment has not yet started, you can manually override the start method by clicking the SHIP button. Then a SHIP SHIPMENT view appears, where the shipping time is “specified,” or the “shipment is shipped now”.
If the shipment has started, you can manually override the delivery method by clicking the DELIVER button. After that, the DELIVER view appears, where the delivery time is “specified” or “the shipment is delivered now.”
When a shipment has been delivered, it is automatically closed once it has been processed—if there are no medium or high excursions in the shipment. A shipment can be manually closed by clicking on the CLOSE NOW button for as long as the shipment's quality is not unknown. If the quality is unknown, the shipment must be manually inspected.
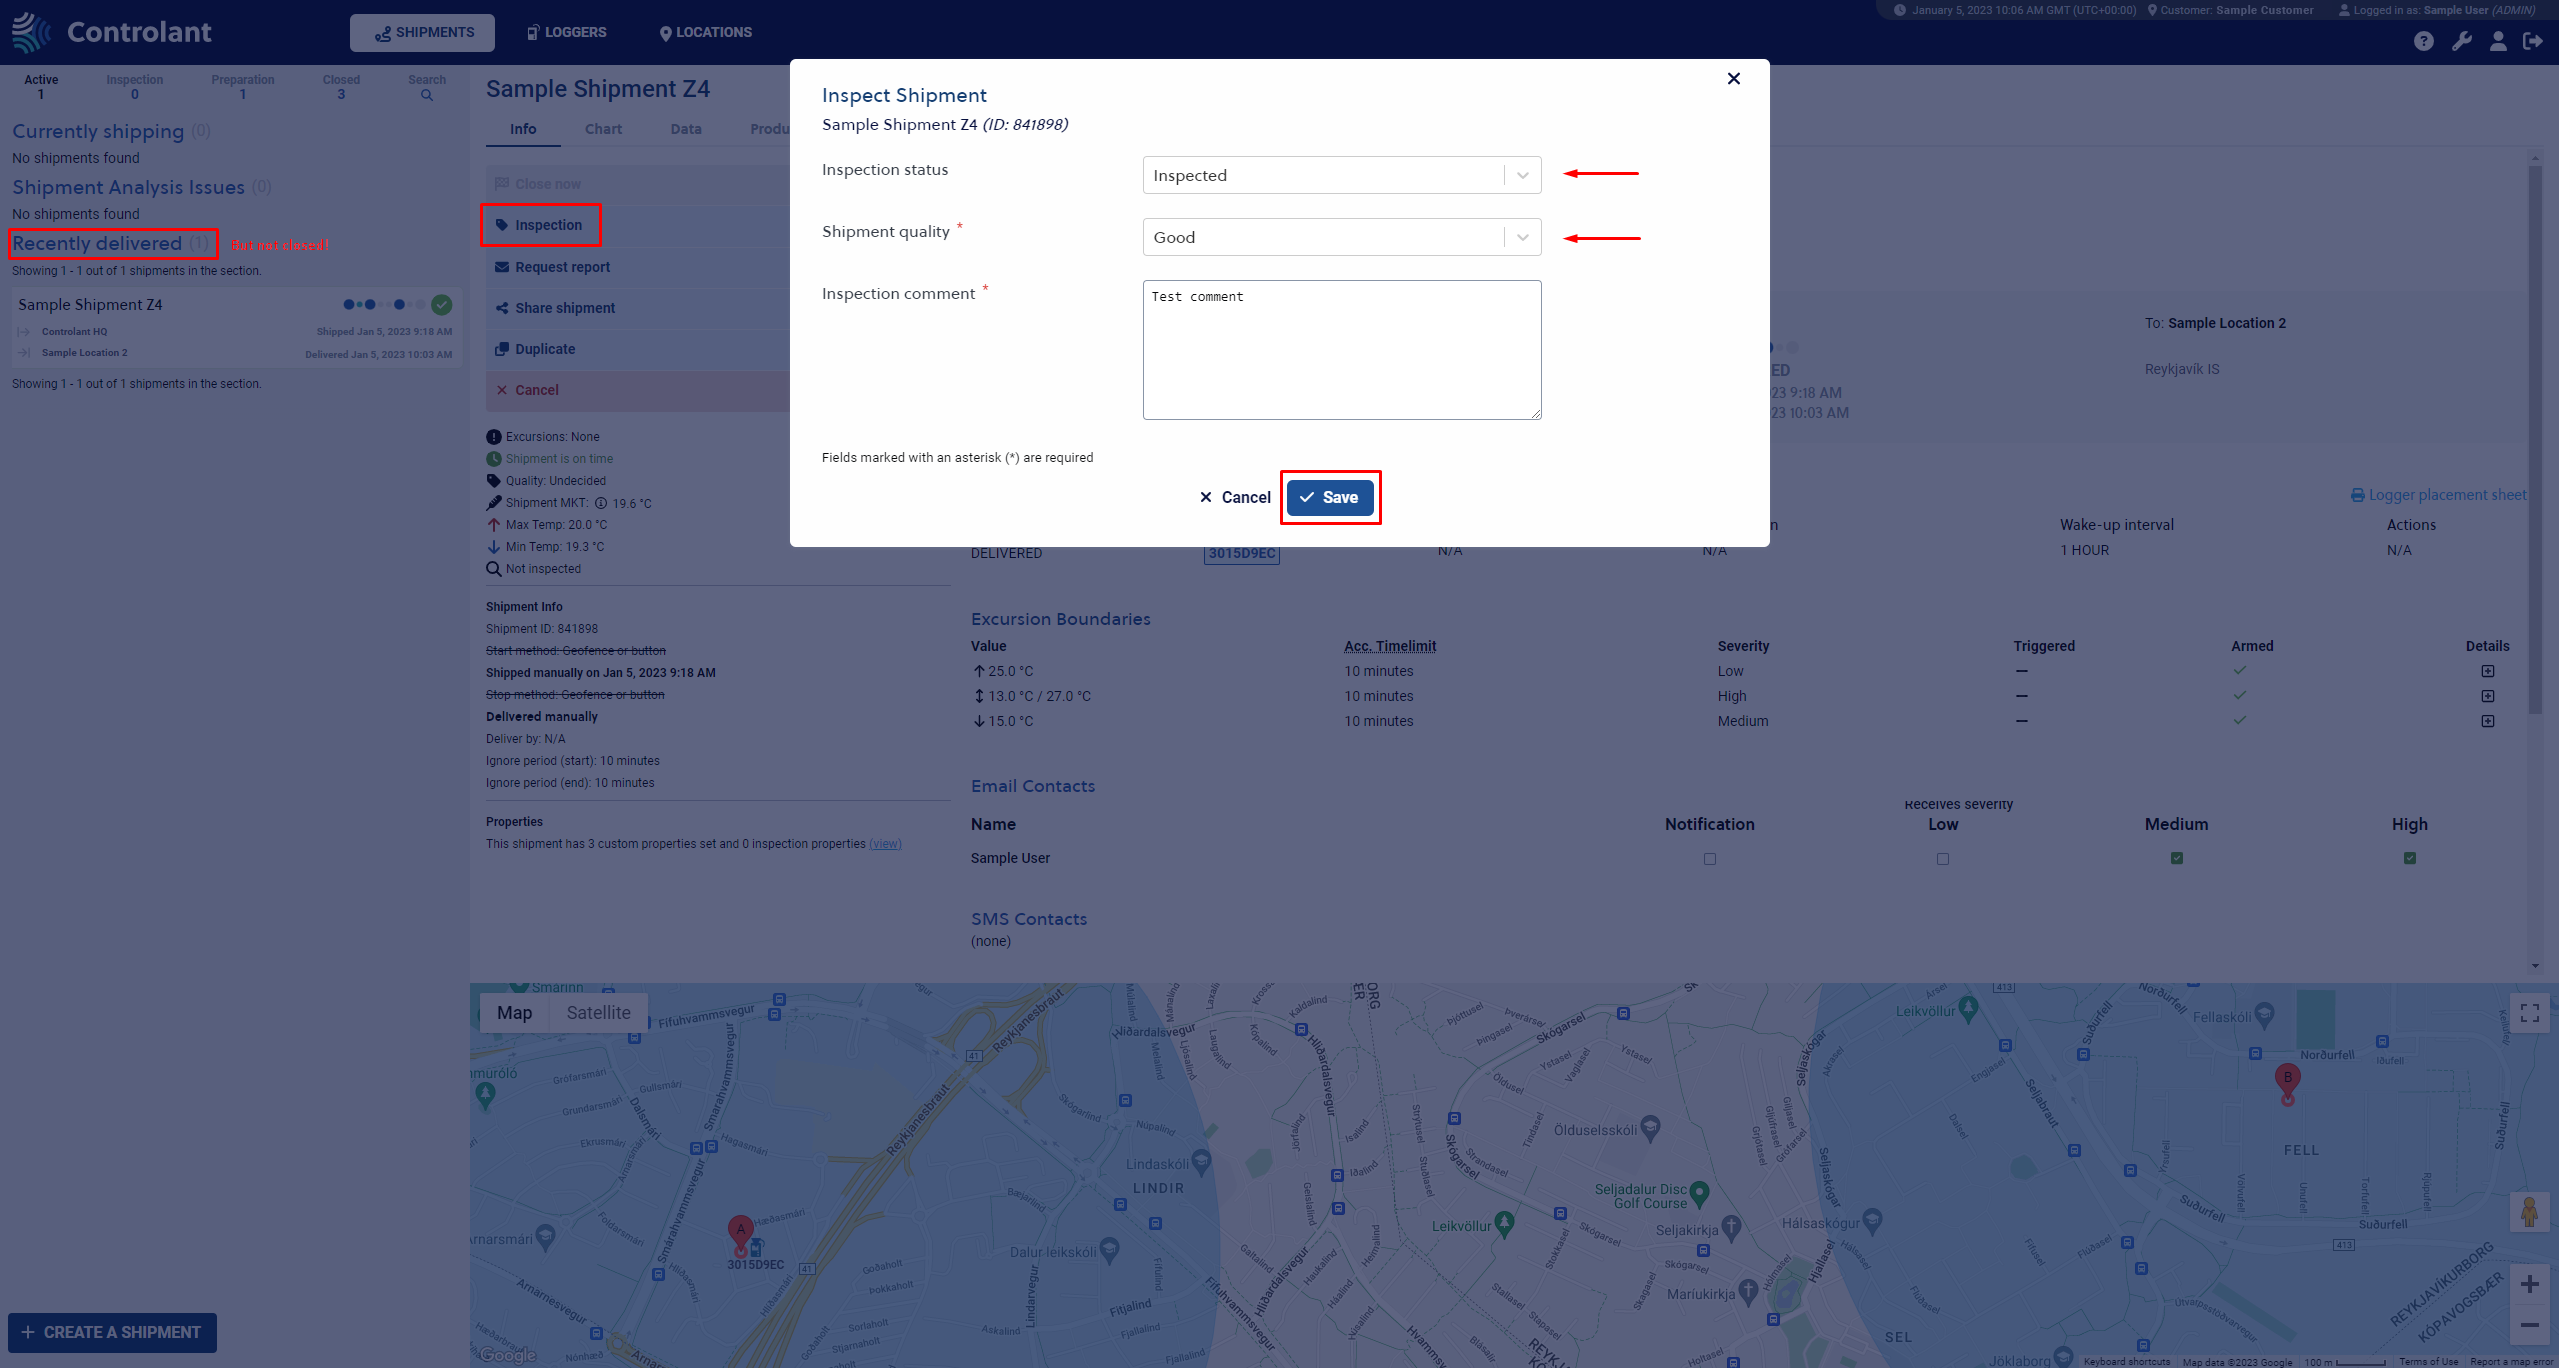
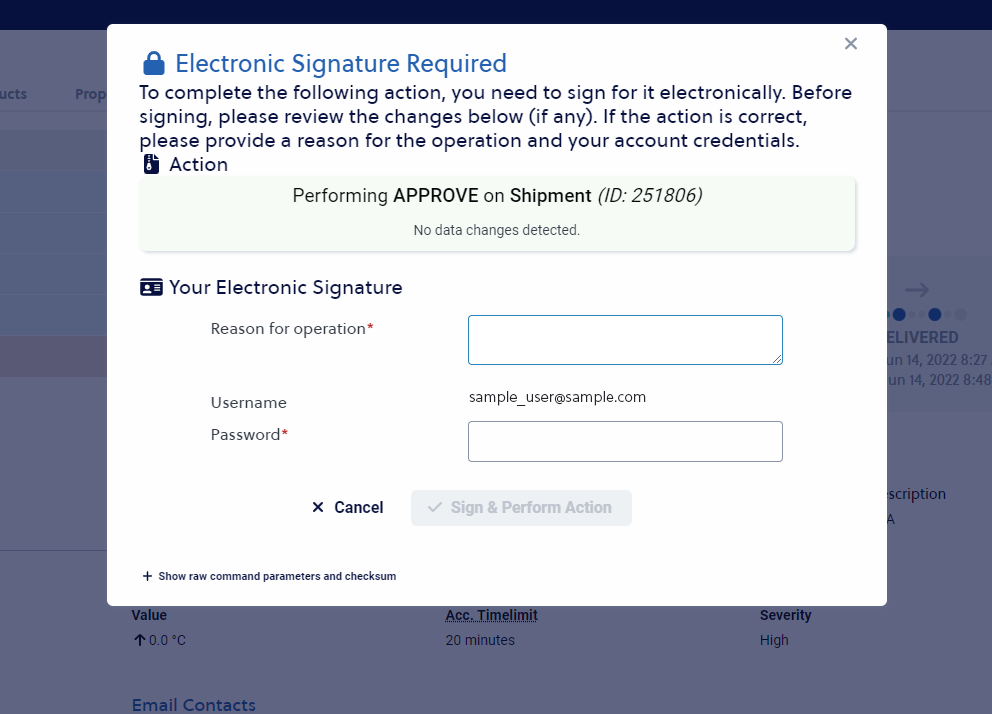
You can change the Shipment quality, Inspection status and add Inspection comments in the shipment for as long as the shipment has not been closed. You can reach the INSPECT SHIPMENT view by clicking the INSPECTION button. The Shipment Inspection view is for quality assurance (QA) personnel to assess shipments in which loggers registered medium or high excursions as good or bad during transit. A customer using the Electronic signature option is required to add the password to complete the inspection. After clicking the Save button in the INSPECT SHIPMENT view, you are directed to the ELECTRONIC SIGNATURE REQUIRED view.
In the Electronic Signature Required view, you must:
give a reason for approving the shipment (Reason for Operation)
type in the username and the password
click on the Sign & Perform Action button
You can review the action's raw command parameters and checksum by clicking Show Raw Command Parameters and Checksum. The inspection can be saved without approval if you are not using the Electronic signature option.
 |
 |
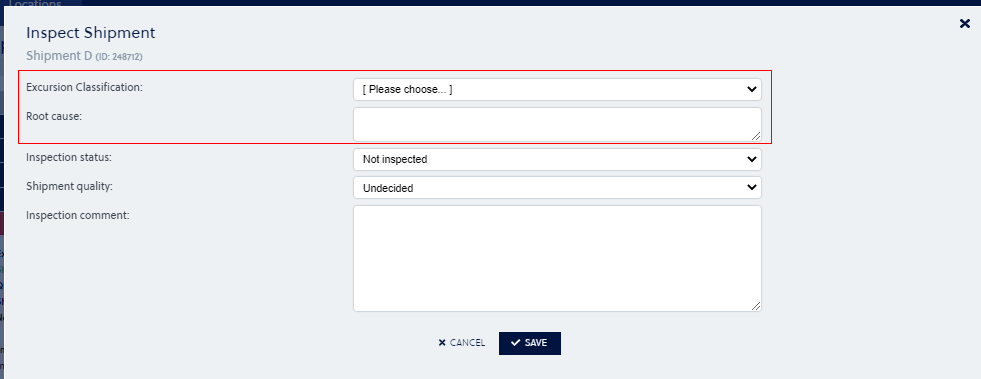
If enabled, Inspection Properties will be accessible in the Inspect Shipment modal. See below an example of an account with two inspection properties; Excursion Classification (enumerable) and Root cause (free text). Details on how to create and manage Inspection properties are accessible here.
 |
You can delete shipments that have not started and cancel shipments that are shipping, delivered, or closed. You can delete a shipment by clicking on the DELETE button and confirming it by clicking on the CONFIRM button. Deleting shipments that have not started is useful if mistakes were made when creating the shipment. Shipments are canceled by clicking on the CANCEL button, and the cancellation is confirmed by clicking on the CONFIRM button. Canceled shipments are hidden but can be found under the Search tab.
Rearming loggers
You can reset boundary alarms if you're a user with admin permission. If a boundary has been triggered for a sensor, it can be reset in the Excursion Boundaries table in the SINGLE SHIPMENT view.
A red “Yes” indicates if a boundary is triggered by one or more loggers. As a result, the boundary is no longer armed, meaning the logger will no longer send alerts for this boundary. Unarmed boundaries are marked with a red ×, and armed boundaries show a green checkmark.
Triggered and Armed statuses for boundaries assume the "worst case" scenario from all loggers in the shipment.
For each boundary, the following applies:
The boundary status is triggered if one logger in the shipment has triggered a boundary breach.
If one logger in the shipment is unarmed, the boundary will also show as unarmed.
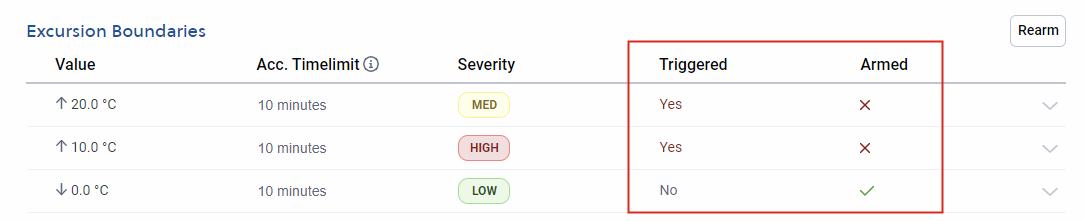
By clicking on a certain boundary, the information for individual loggers appears. They include information on whether a particular logger is armed and how often each logger has triggered this specific boundary.
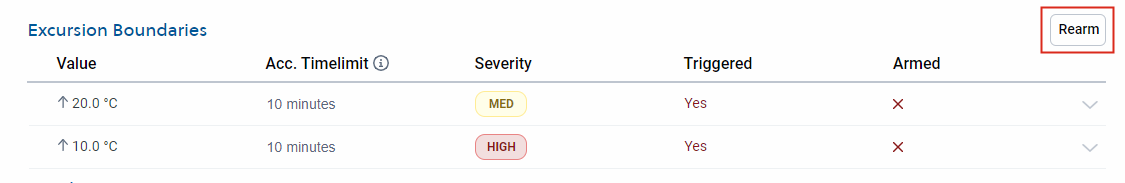
To rearm a logger or multiple loggers, click on the REARM button.
This will allow you to choose the loggers you want to rearm by ticking the checkboxes next to them. From the drop-down menu, select when the rearming should take effect, and click on “Apply (#)”. This will send a message to the selected loggers, and the armed status will be updated accordingly.
If you set a boundary to rearm later, a clock icon indicates it in the ARMED column.
When rearming boundaries, the logger can only receive the command to rearm a boundary when it wakes up. A wake-up only occurs on a preset interval, when a button is pressed on the logger, or if the logger detects an excursion.
The earliest a rearmed logger can issue further alerts is at its next wake-up, regardless of the delay selected. For example, if you choose to rearm a logger immediately, but the logger is not scheduled to wake up for 40 minutes, the earliest you can receive an alert is in 40 minutes.
When rearming a logger, the accumulative time limit will not be reset. This means that if the logger is still experiencing an excursion, an alert will immediately be issued when the logger wakes up and receives the command to rearm the boundary. To avoid this issue , ensure the logger has returned to acceptable boundary ranges before rearming it. Additionally, if the excursion has been resolved, but the logger detects conditions that breach the boundary, it will immediately issue an alert rather than waiting for the set time.
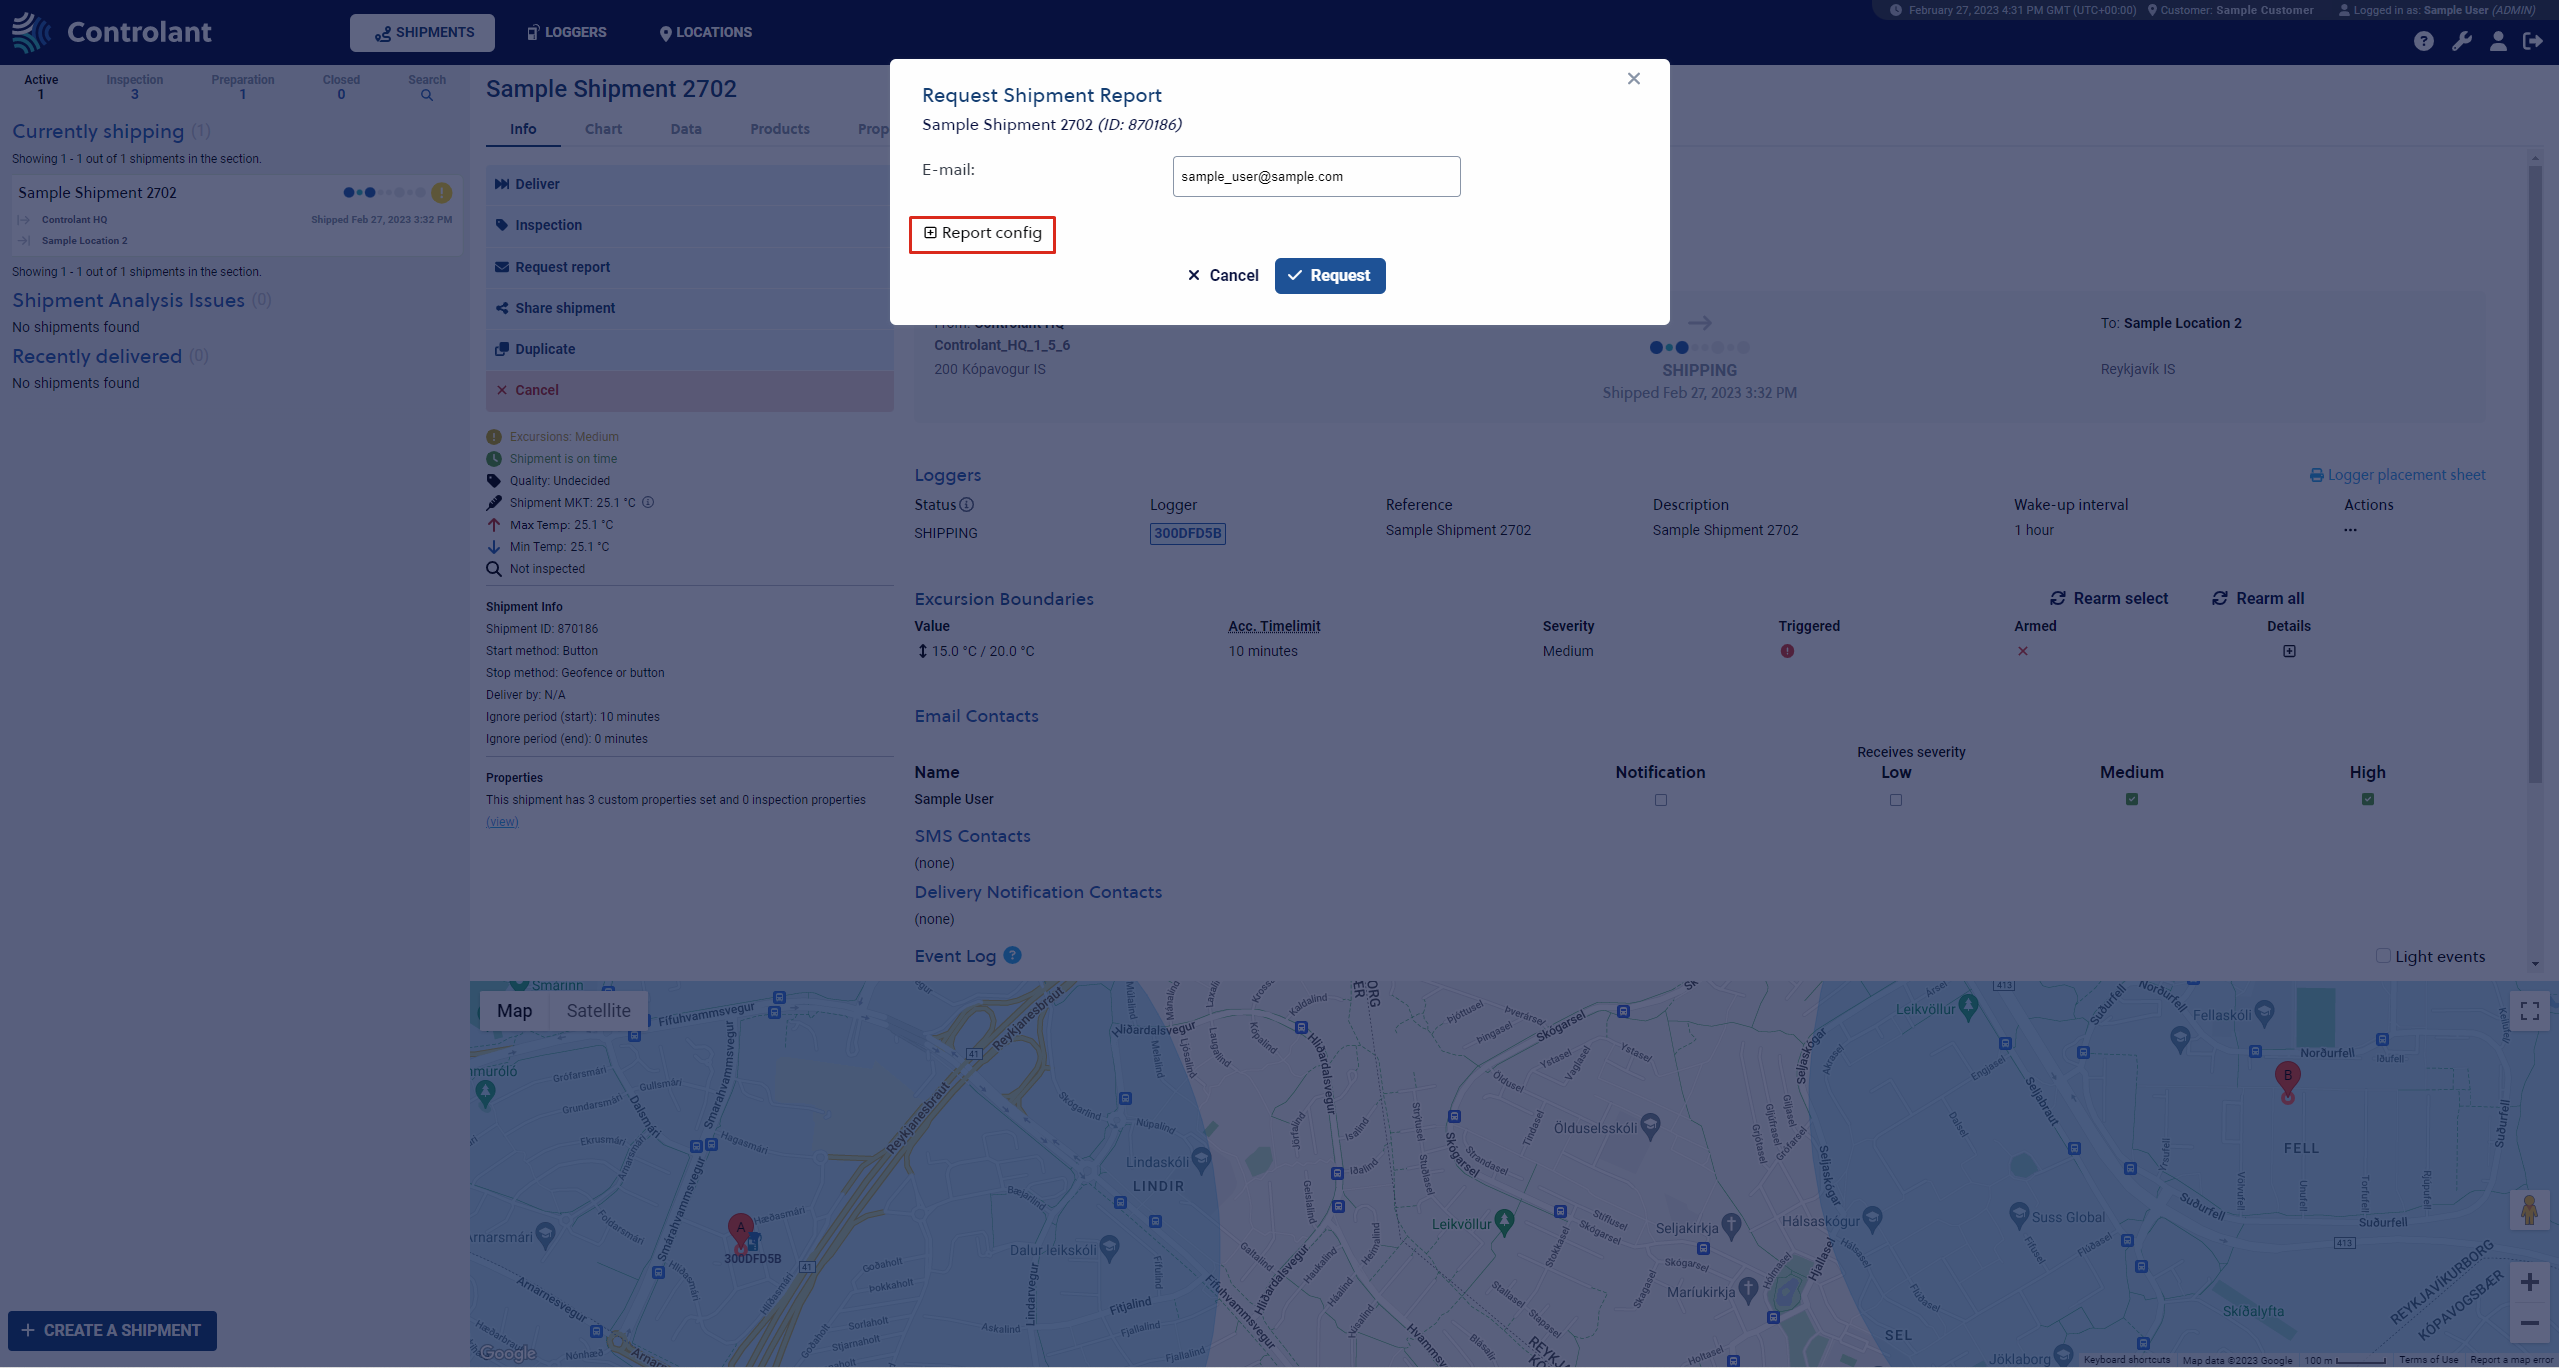
Request Report
When a shipment is closed, you can request a report in the Single Shipment view by clicking on the Request Report button. Reports can be requested from shipments that are Shipping, Delivered, and Closed. Clicking on Request Report opens a modal where you have to provide an email address and can choose to get extra data with the report by setting some Report config.
 |
The Report config has default settings set by your administrator, but you can overwrite them by changing the configurations in the modal.
 |
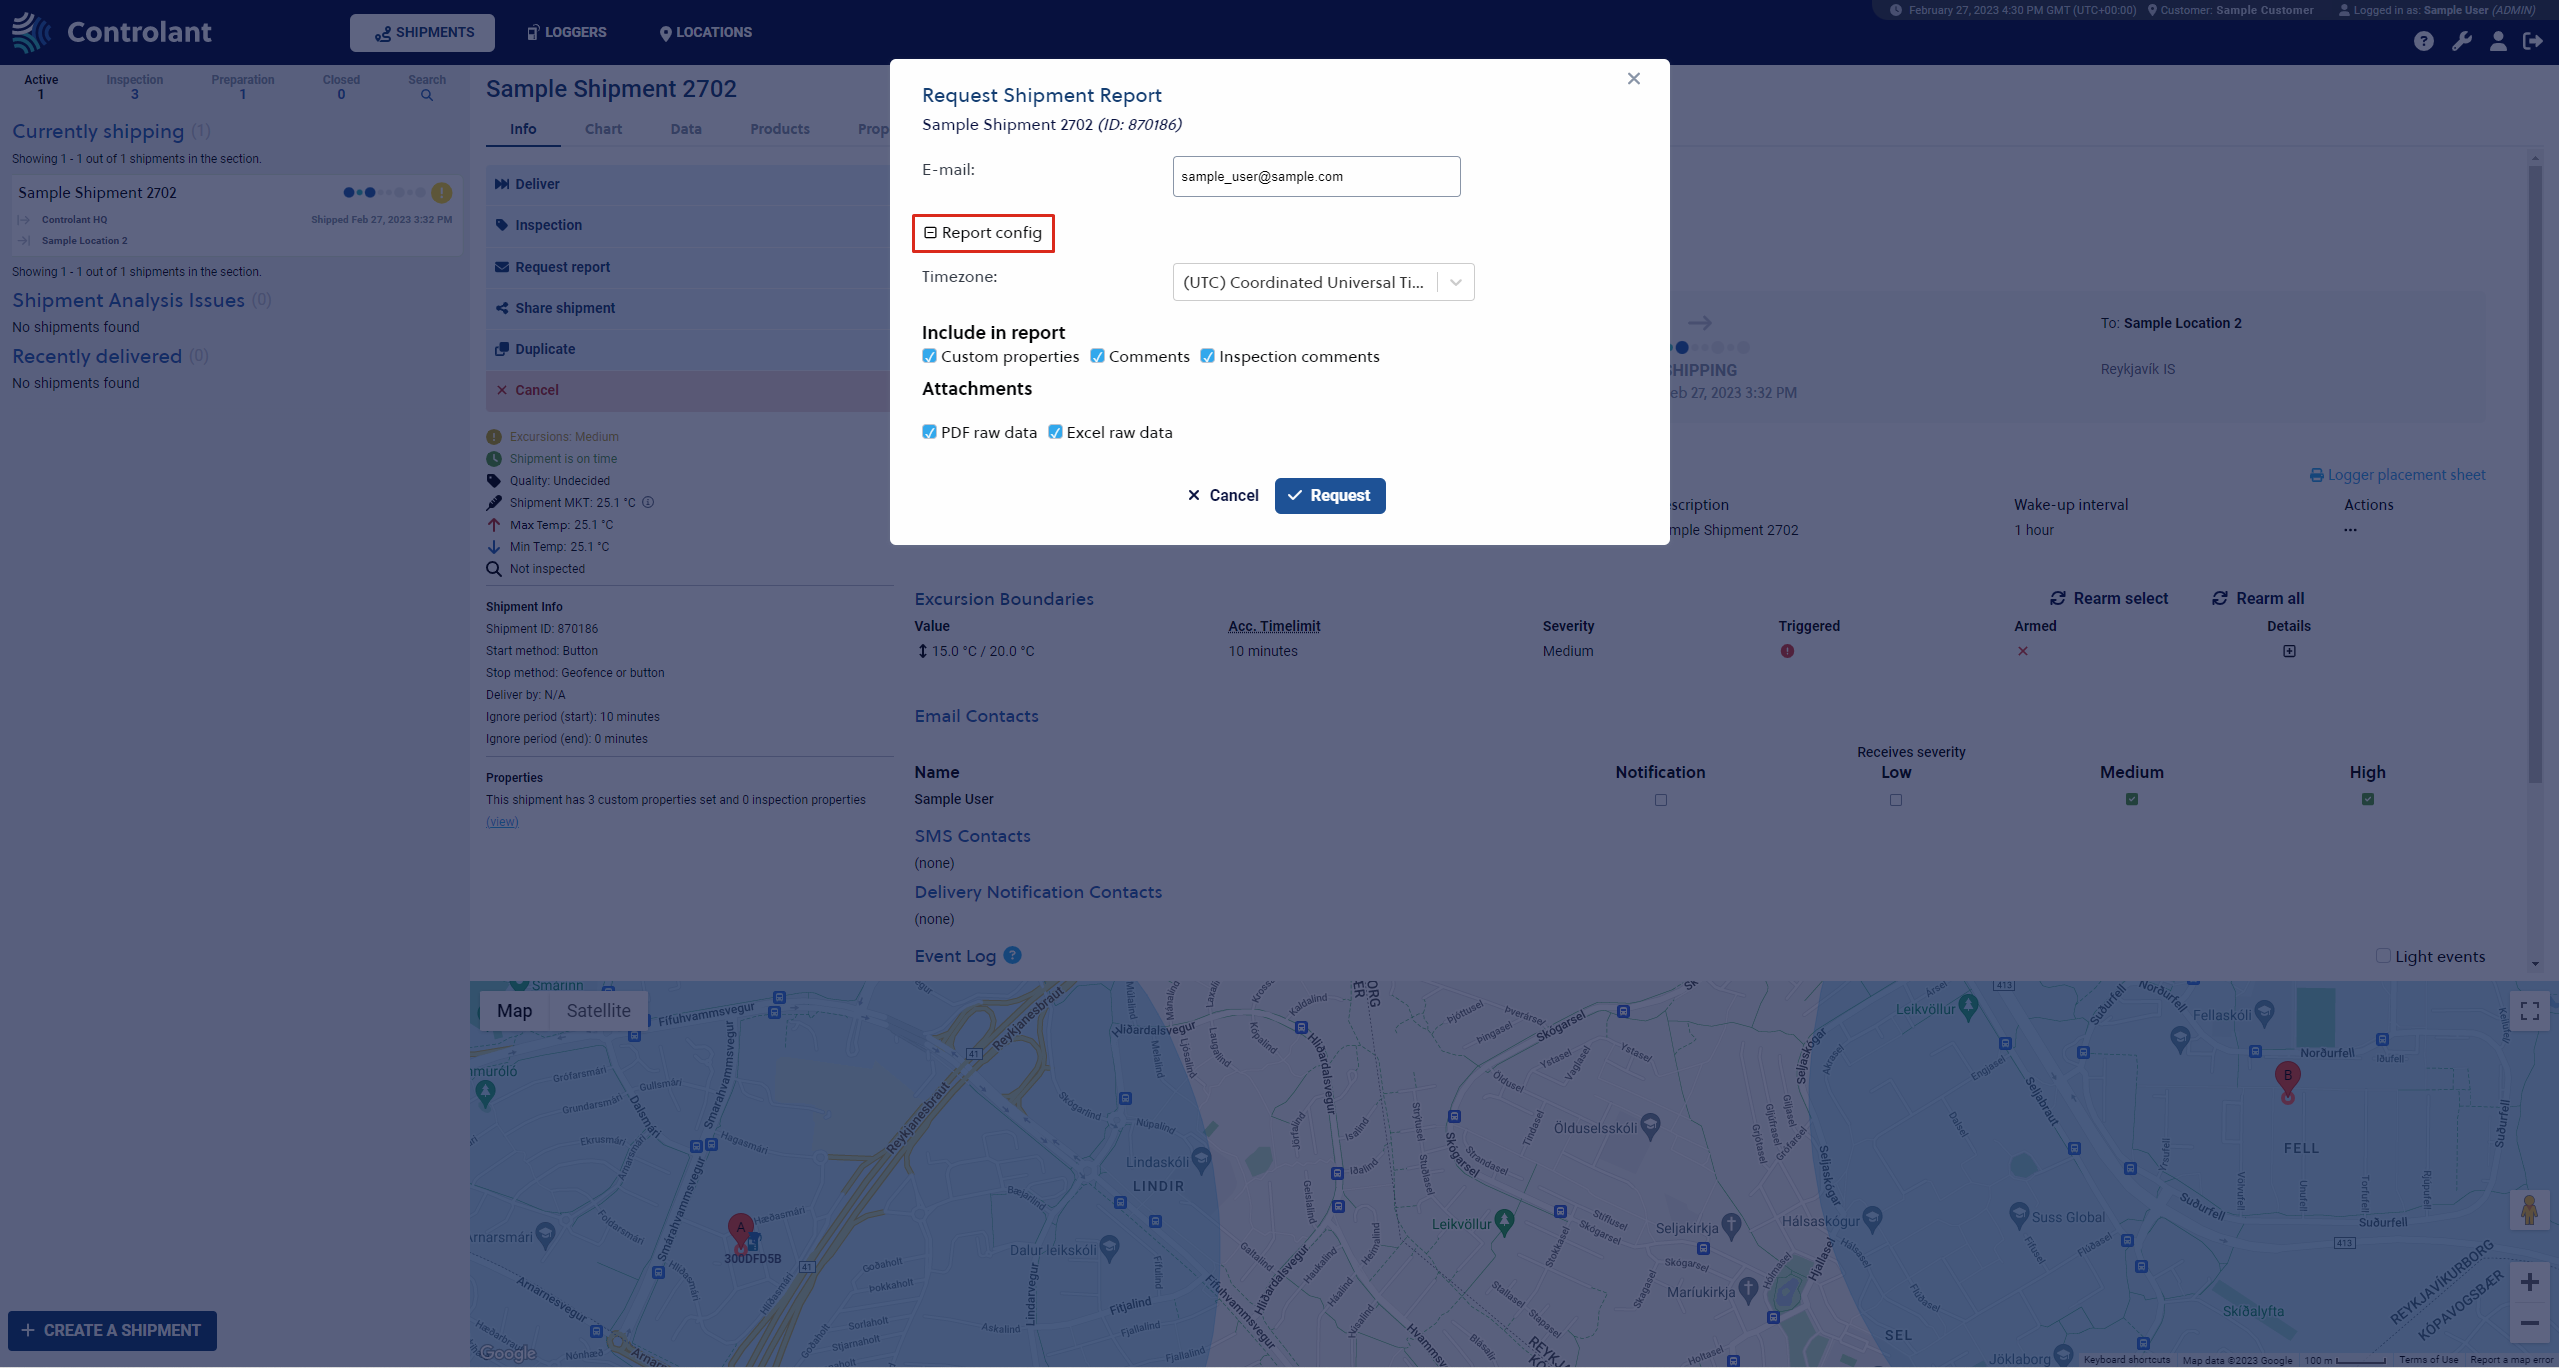 |
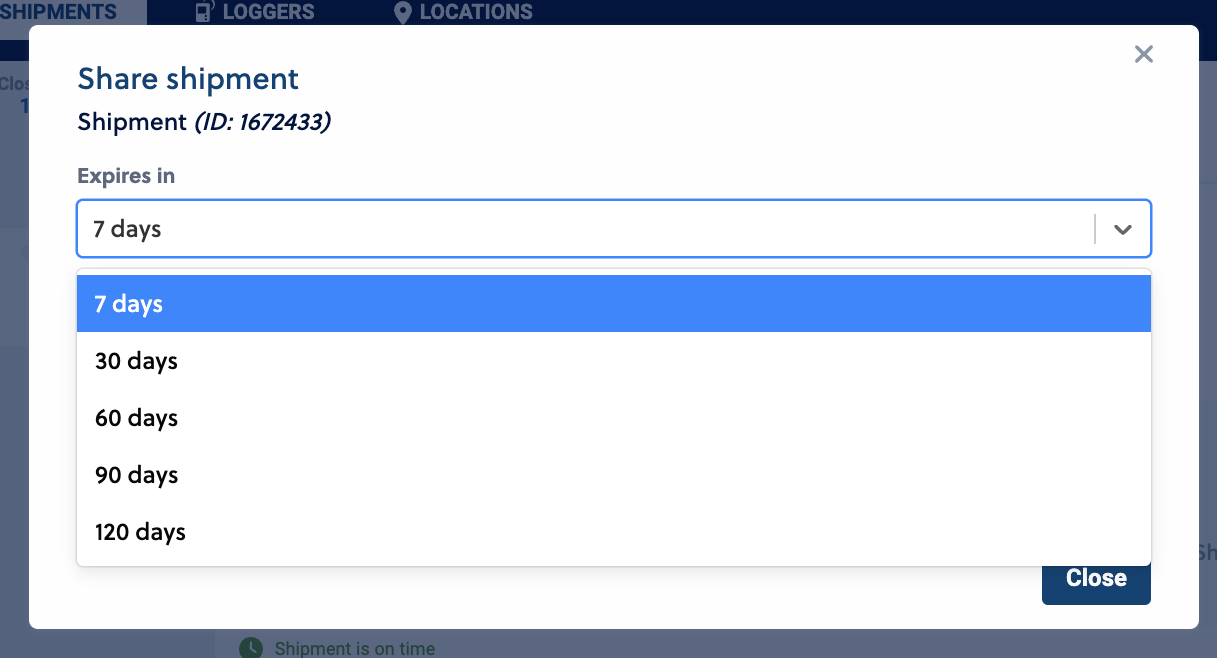
Share shipment
By clicking on the "Share shipment" option, the system generates a shareable link that can be copied or sent by email through the system. To choose how long the link should be live, click on the drop-down menu labeled "Expires in" and choose from the five options: 7, 30, 60, 90, and 120 days.
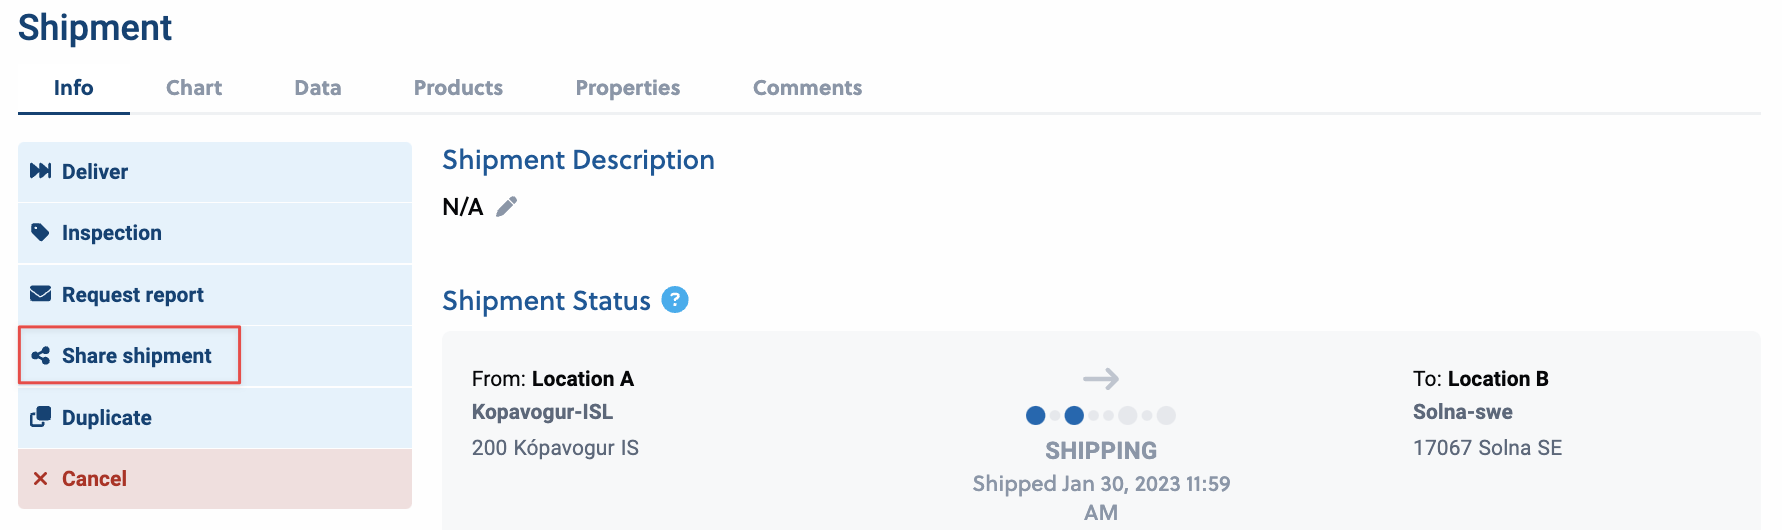
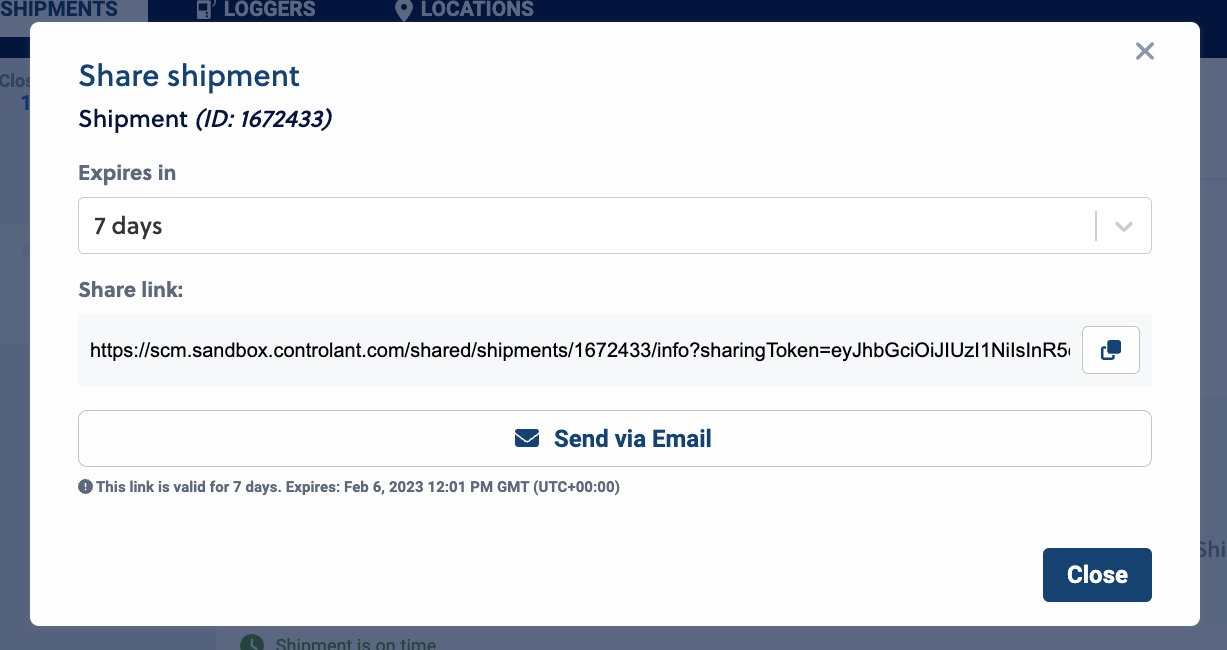 |
 |
Shipment Filter tabs
In the upper left corner of the shipments view, shipments can be filtered by the following five tabs:
Active
Inspection
Preparation
Closed
Search
Active
In the Active tab, shipments that are currently shipping or are recently delivered can be seen.
When shipments start shipping, they appear under Currently Shipping. When the shipments are delivered, they move from Currently shipping to Recently delivered.
They stay there until the cloud processes them. When they have been processed, they are either closed automatically and moved to the closed tab or moved to the inspection tab. This depends on a customer setting where you must manually inspect Shipments at or above a selected severity level. The system will automatically inspect and close shipments below the selected severity level.
 |
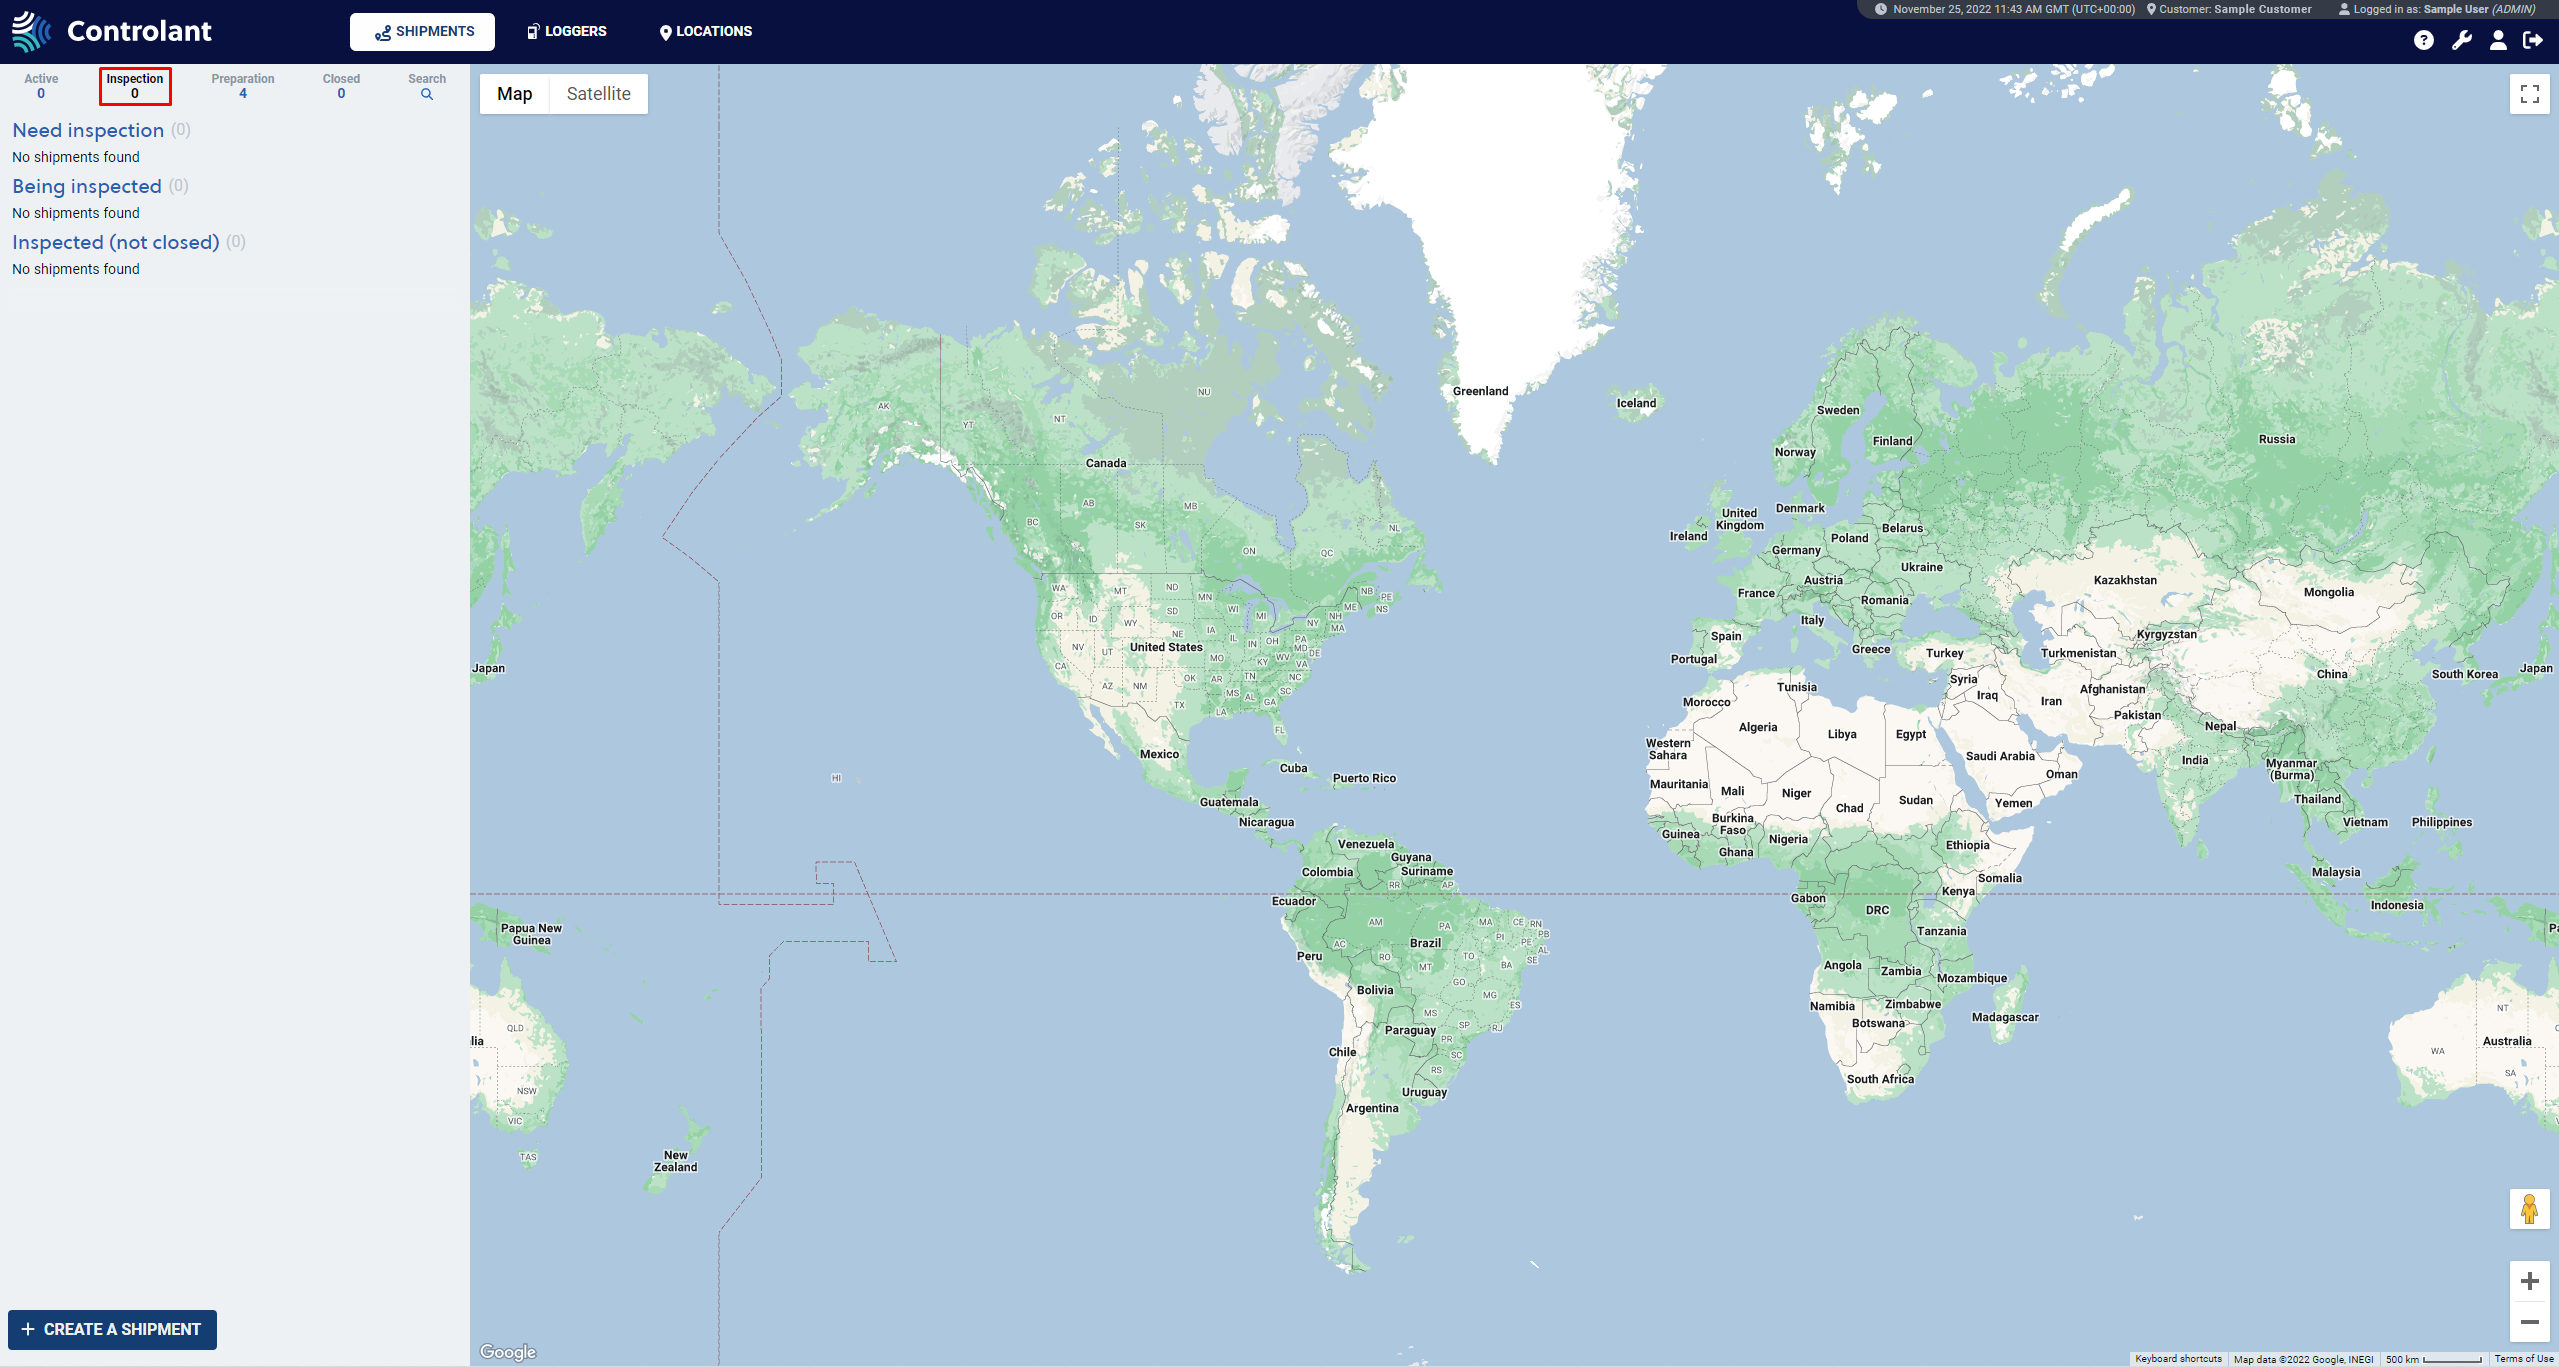
Inspection
In the Inspection tab, shipments that have "shipment quality" set to undecided can be seen.
Shipments end up with the "shipment quality" set to undecided due to Medium and High excursions in the shipments. The shipments are split into three lists depending on whether they Need inspection, are Being Inspected, or have already been Inspected (Not Closed).
 |
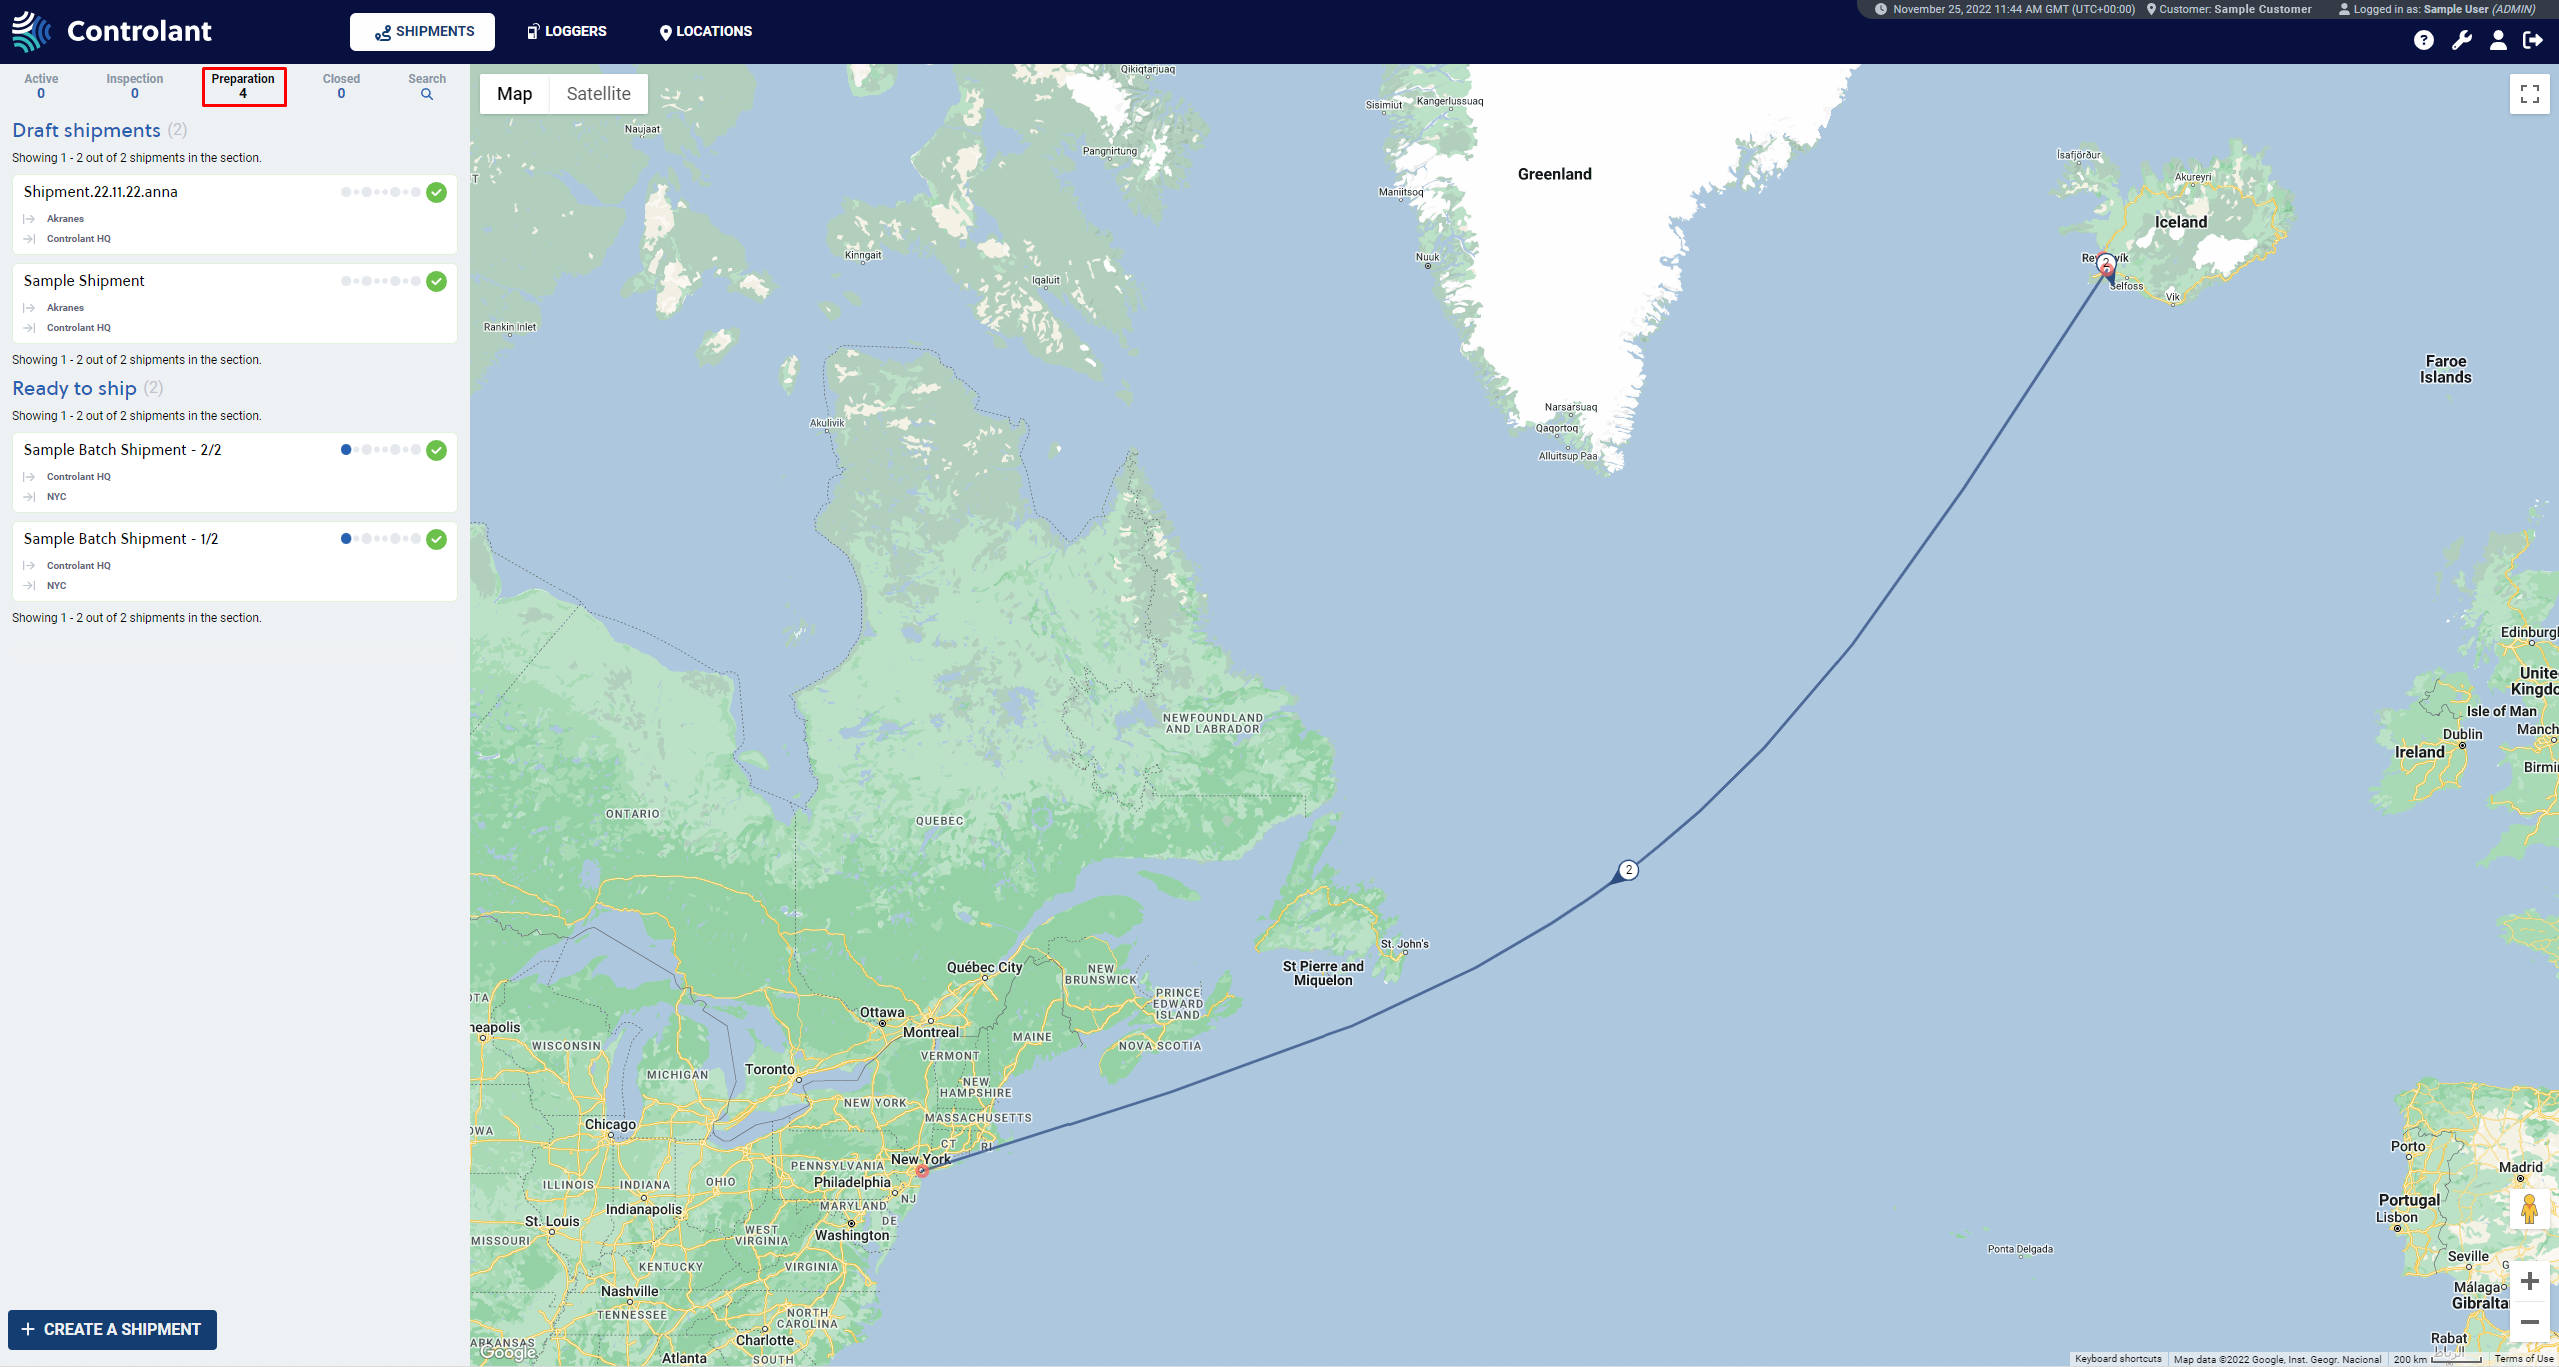
Preparation
In the Preparation tab, shipments saved as Draft or created as Ready to Ship can be seen.
The Draft shipments remain as drafts until they are made "Ready" in the Shipment view. The ready shipment will stay there until they ship with one of the start methods or by clicking on the ship button in the shipment view.
 |
Closed
In the Closed tab, shipments that have been closed can be seen.
 |
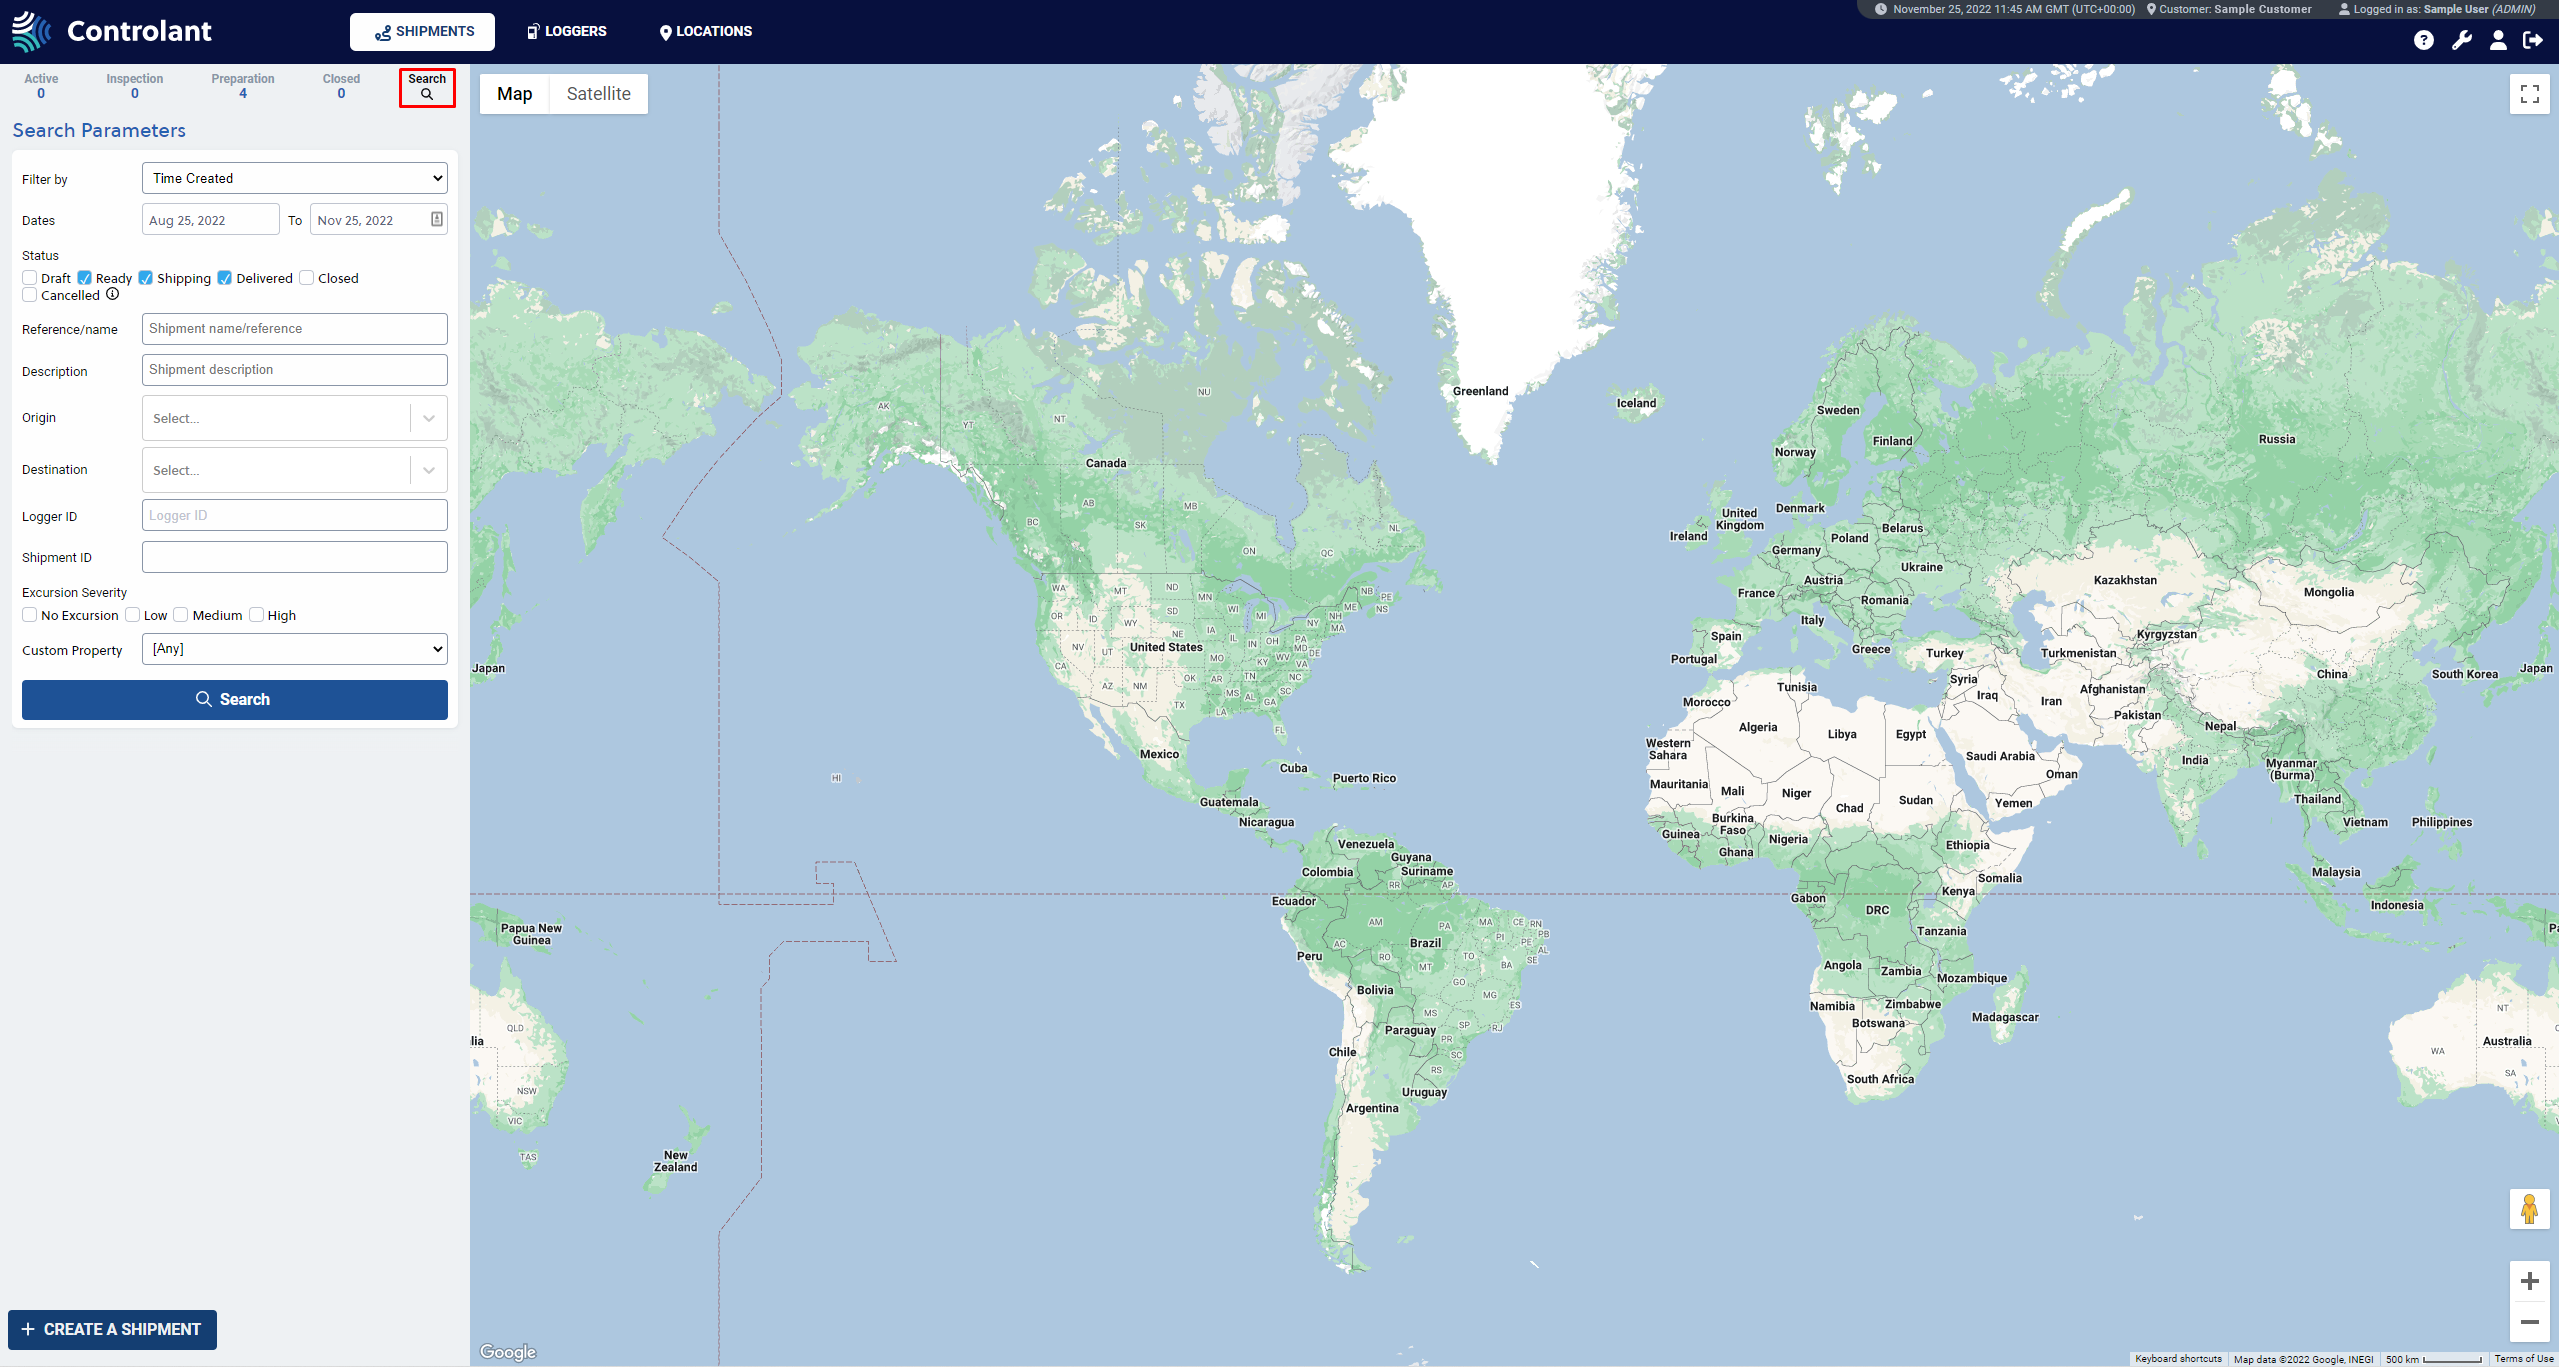
Search
In the Search tab, you can search for shipments with specific parameters. Shipment searches are filtered by Time (Time Created, Time Shipped, Time Delivered, and Time Closed) and the search period (From and To). It's possible to search for shipments by Status (Draft, Ready, Shipping, Delivered, Closed, and Cancelled), Reference/name, Origin and Destination, Logger ID, Controlant Shipment ID, Excursion Severity (No Excursion, Low, Medium, and High), and Custom Property. The fields that are in bold are required. The search results are displayed below the fields after clicking on the Search button.
 |
The shipment status bar explained
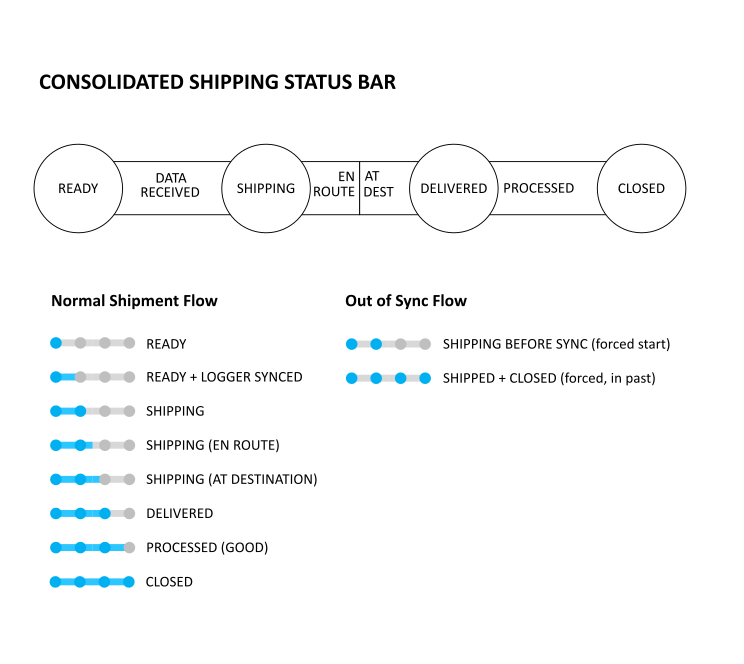 |
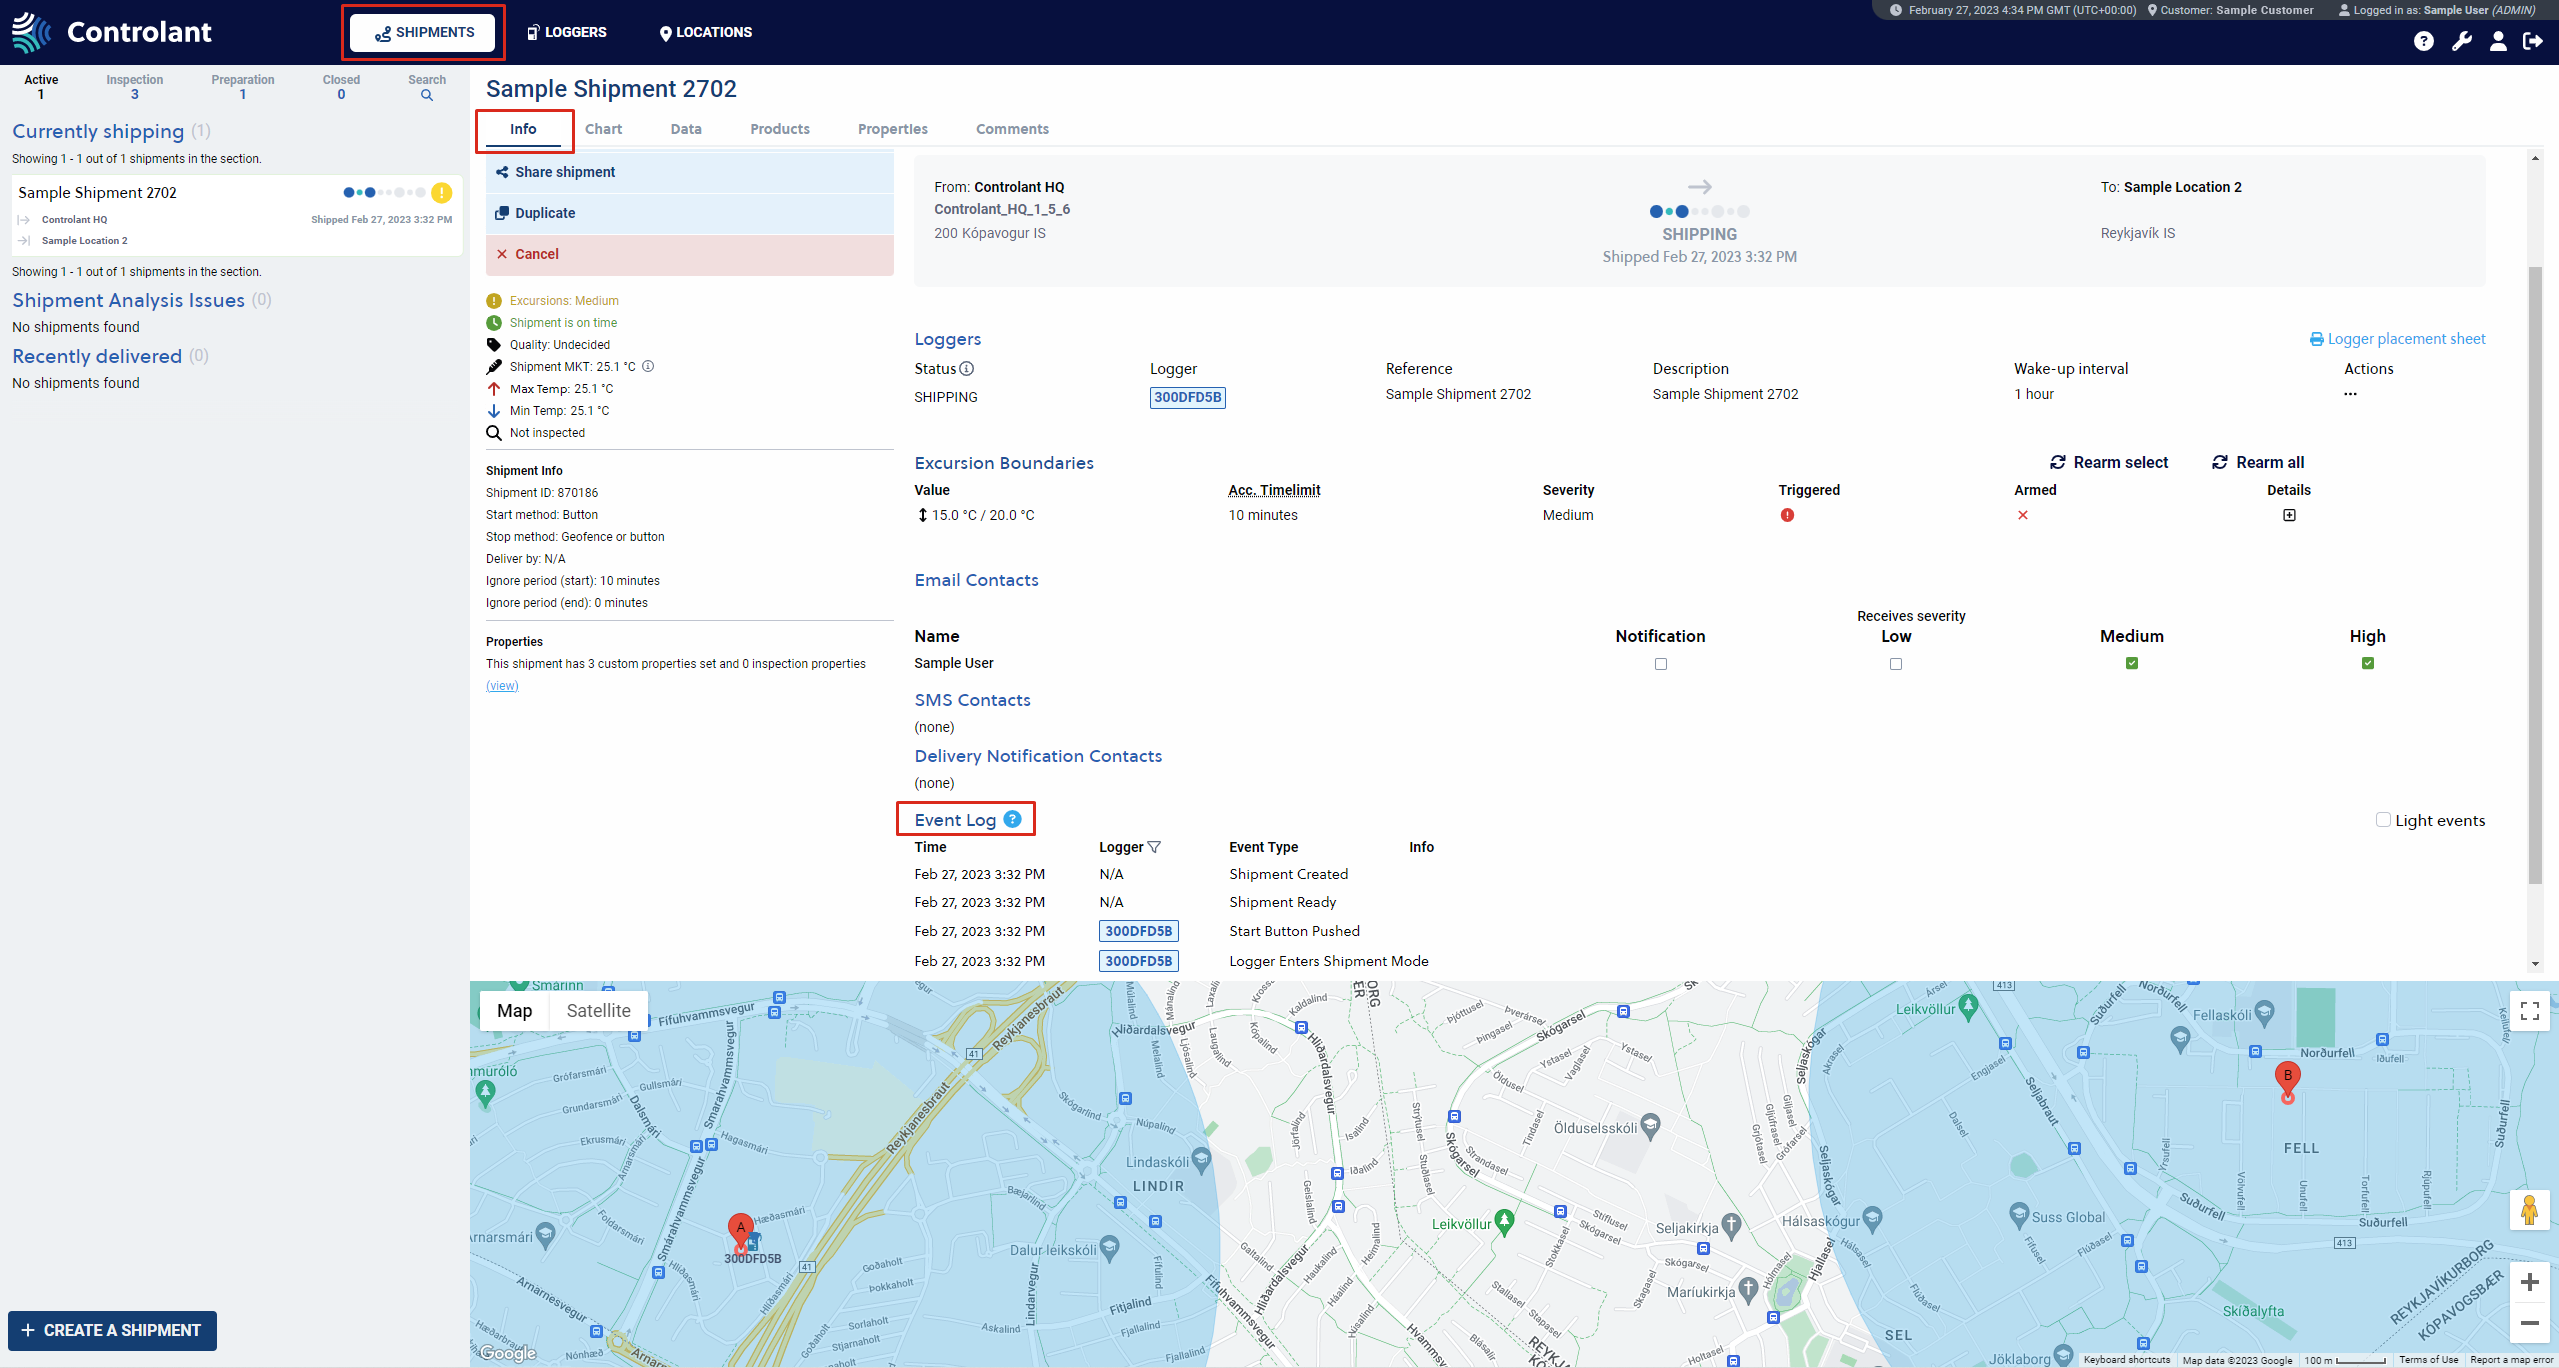
Shipment event types
In a single shipment view, under the Info tab, all events from when a shipment is created until delivery are displayed below the Event Log. Below is a list explaining possible events.
Excursion
Any excursions that may occur during the shipment, i.e., temperature going over the upper boundaries or under the lower boundaries. Upper and lower boundaries can be specified for the shipment.
Start Button Pushed
The Start button was pressed during the shipment.
Stop button Pushed
The Stop button was pressed during the shipment.
Logger Enters Shipment Mode
The logger has entered shipping mode, i.e., the logger is being used in a shipment.
Logger Enters Standby Mode
The logger has entered standby mode, i.e., the logger is not in use.
Logger At Origin
The logger is at a shipment origin location.
Logger At Destination
The logger is at the shipment delivery location.
Logger En Route
The logger in a shipment is on a shipping route.
Shipment Created
Shipment was created at this time.
Shipment Shipped
Shipment was started at this time.
Shipment Delivered
Shipment was delivered at this time.
Shipment Closed
The shipment has been closed after delivery.
Shipment Cancelled
Shipment was canceled, either before the shipment was shipped or after a shipment was closed.
Lights Off
Lights were turned off in the shipment. An event that happens when a logger in a shipment is placed in a dark space, for example, inside a sealed box after being exposed to bright lights.
Lights On
Lights were turned on in the shipment. An event that happens when a logger in a shipment is affected by light, for example, when a logger is inside a sealed box, and the box is exposed to bright lights.
Logger filter in Event Log
It is possible to filter the Event Log by selecting logger(s) in the filtered Logger list.
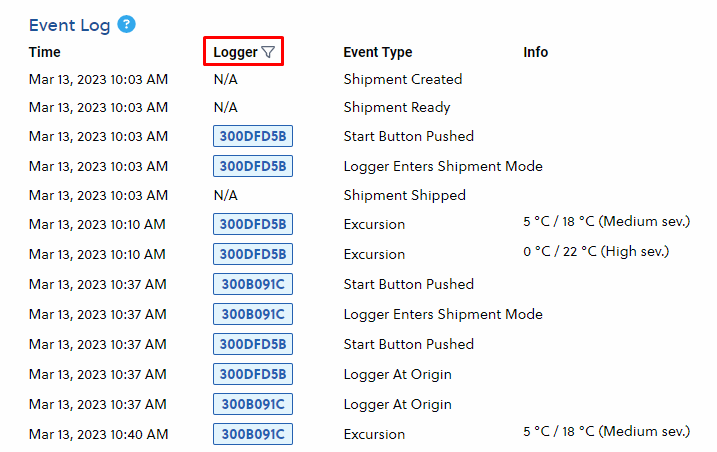 |
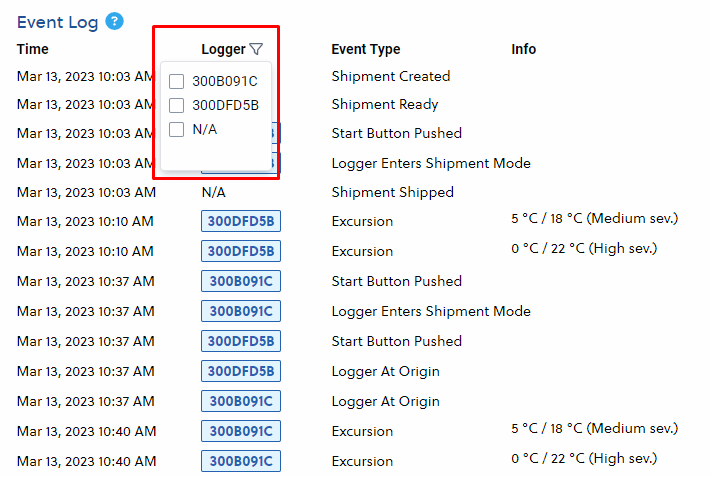
The user selects loggers by clicking the downward-facing black arrow (to the right of the Logger list).
Select one or more loggers.
N/A are shipment events not tied to a specific logger, such as Shipment Closed.
If no selection is made, all events are displayed.
 |
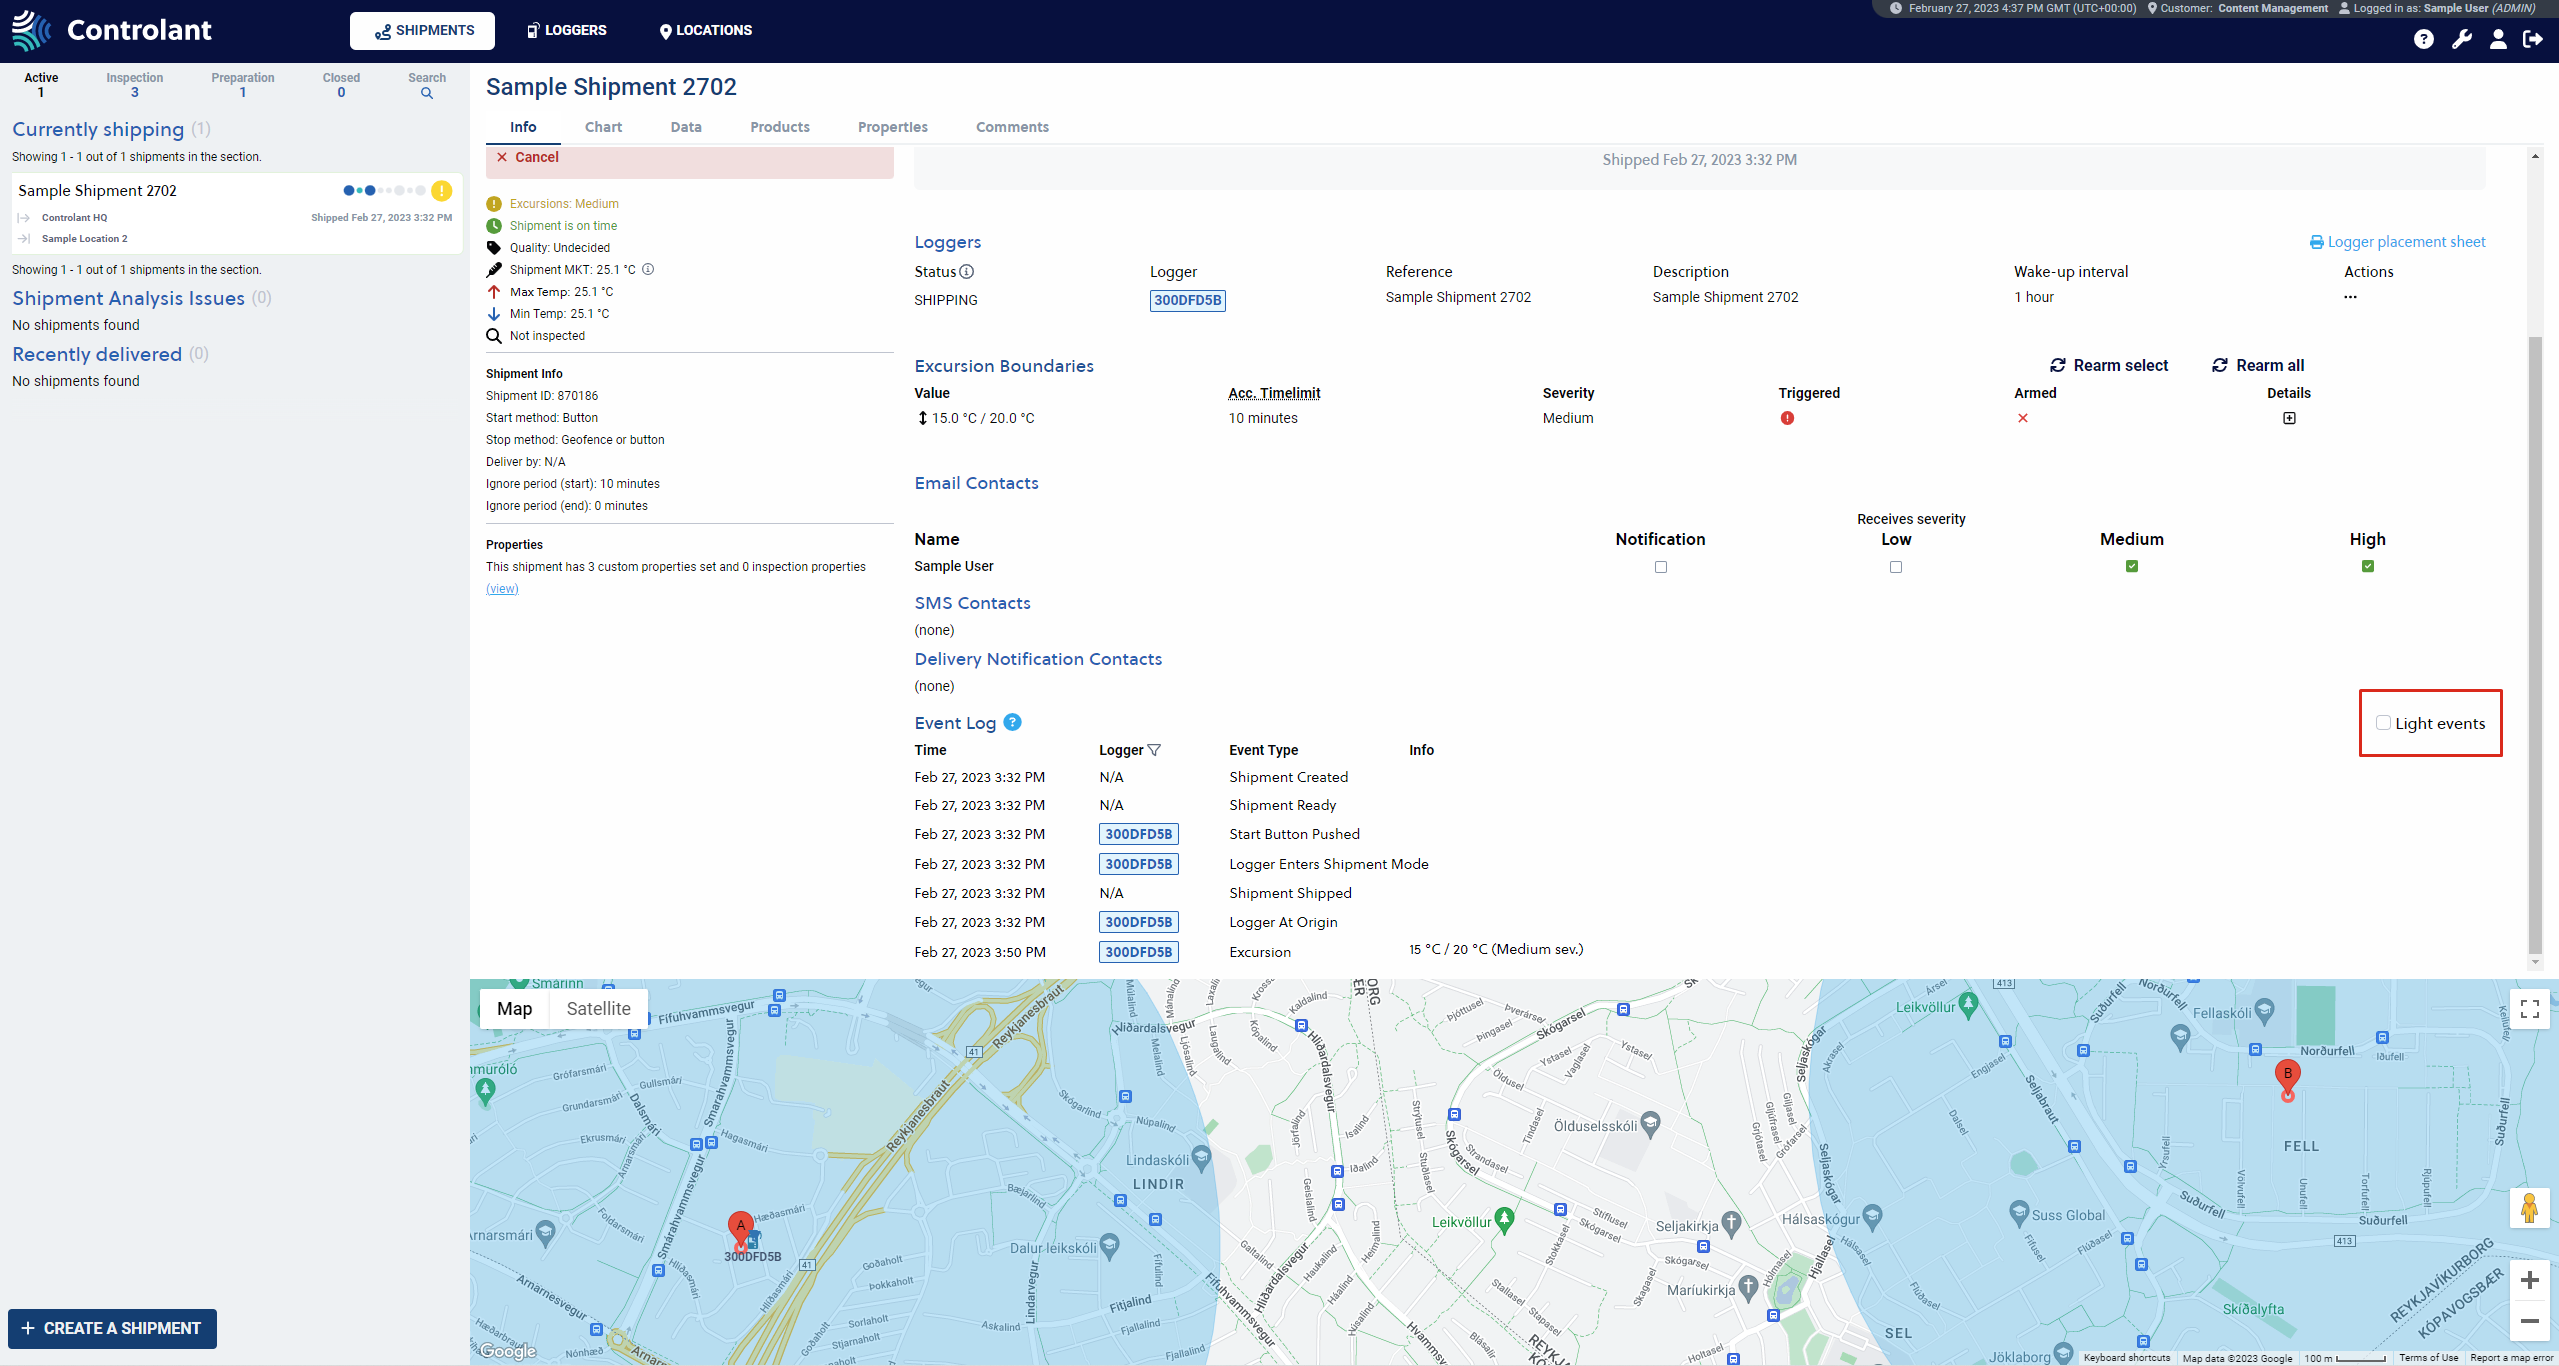
Light Events
By default, the Light events are hidden in the SCM UI. They can be displayed by checking the checkbox Light events in the Single Shipment viewhttps://docs-controlant.atlassian.net/wiki/download/attachments/262348/Single%20Shipment%20View.png?version=2&modificationDate=1495212518853&cacheVersion=1&api=v2to the right of the Event Log title.
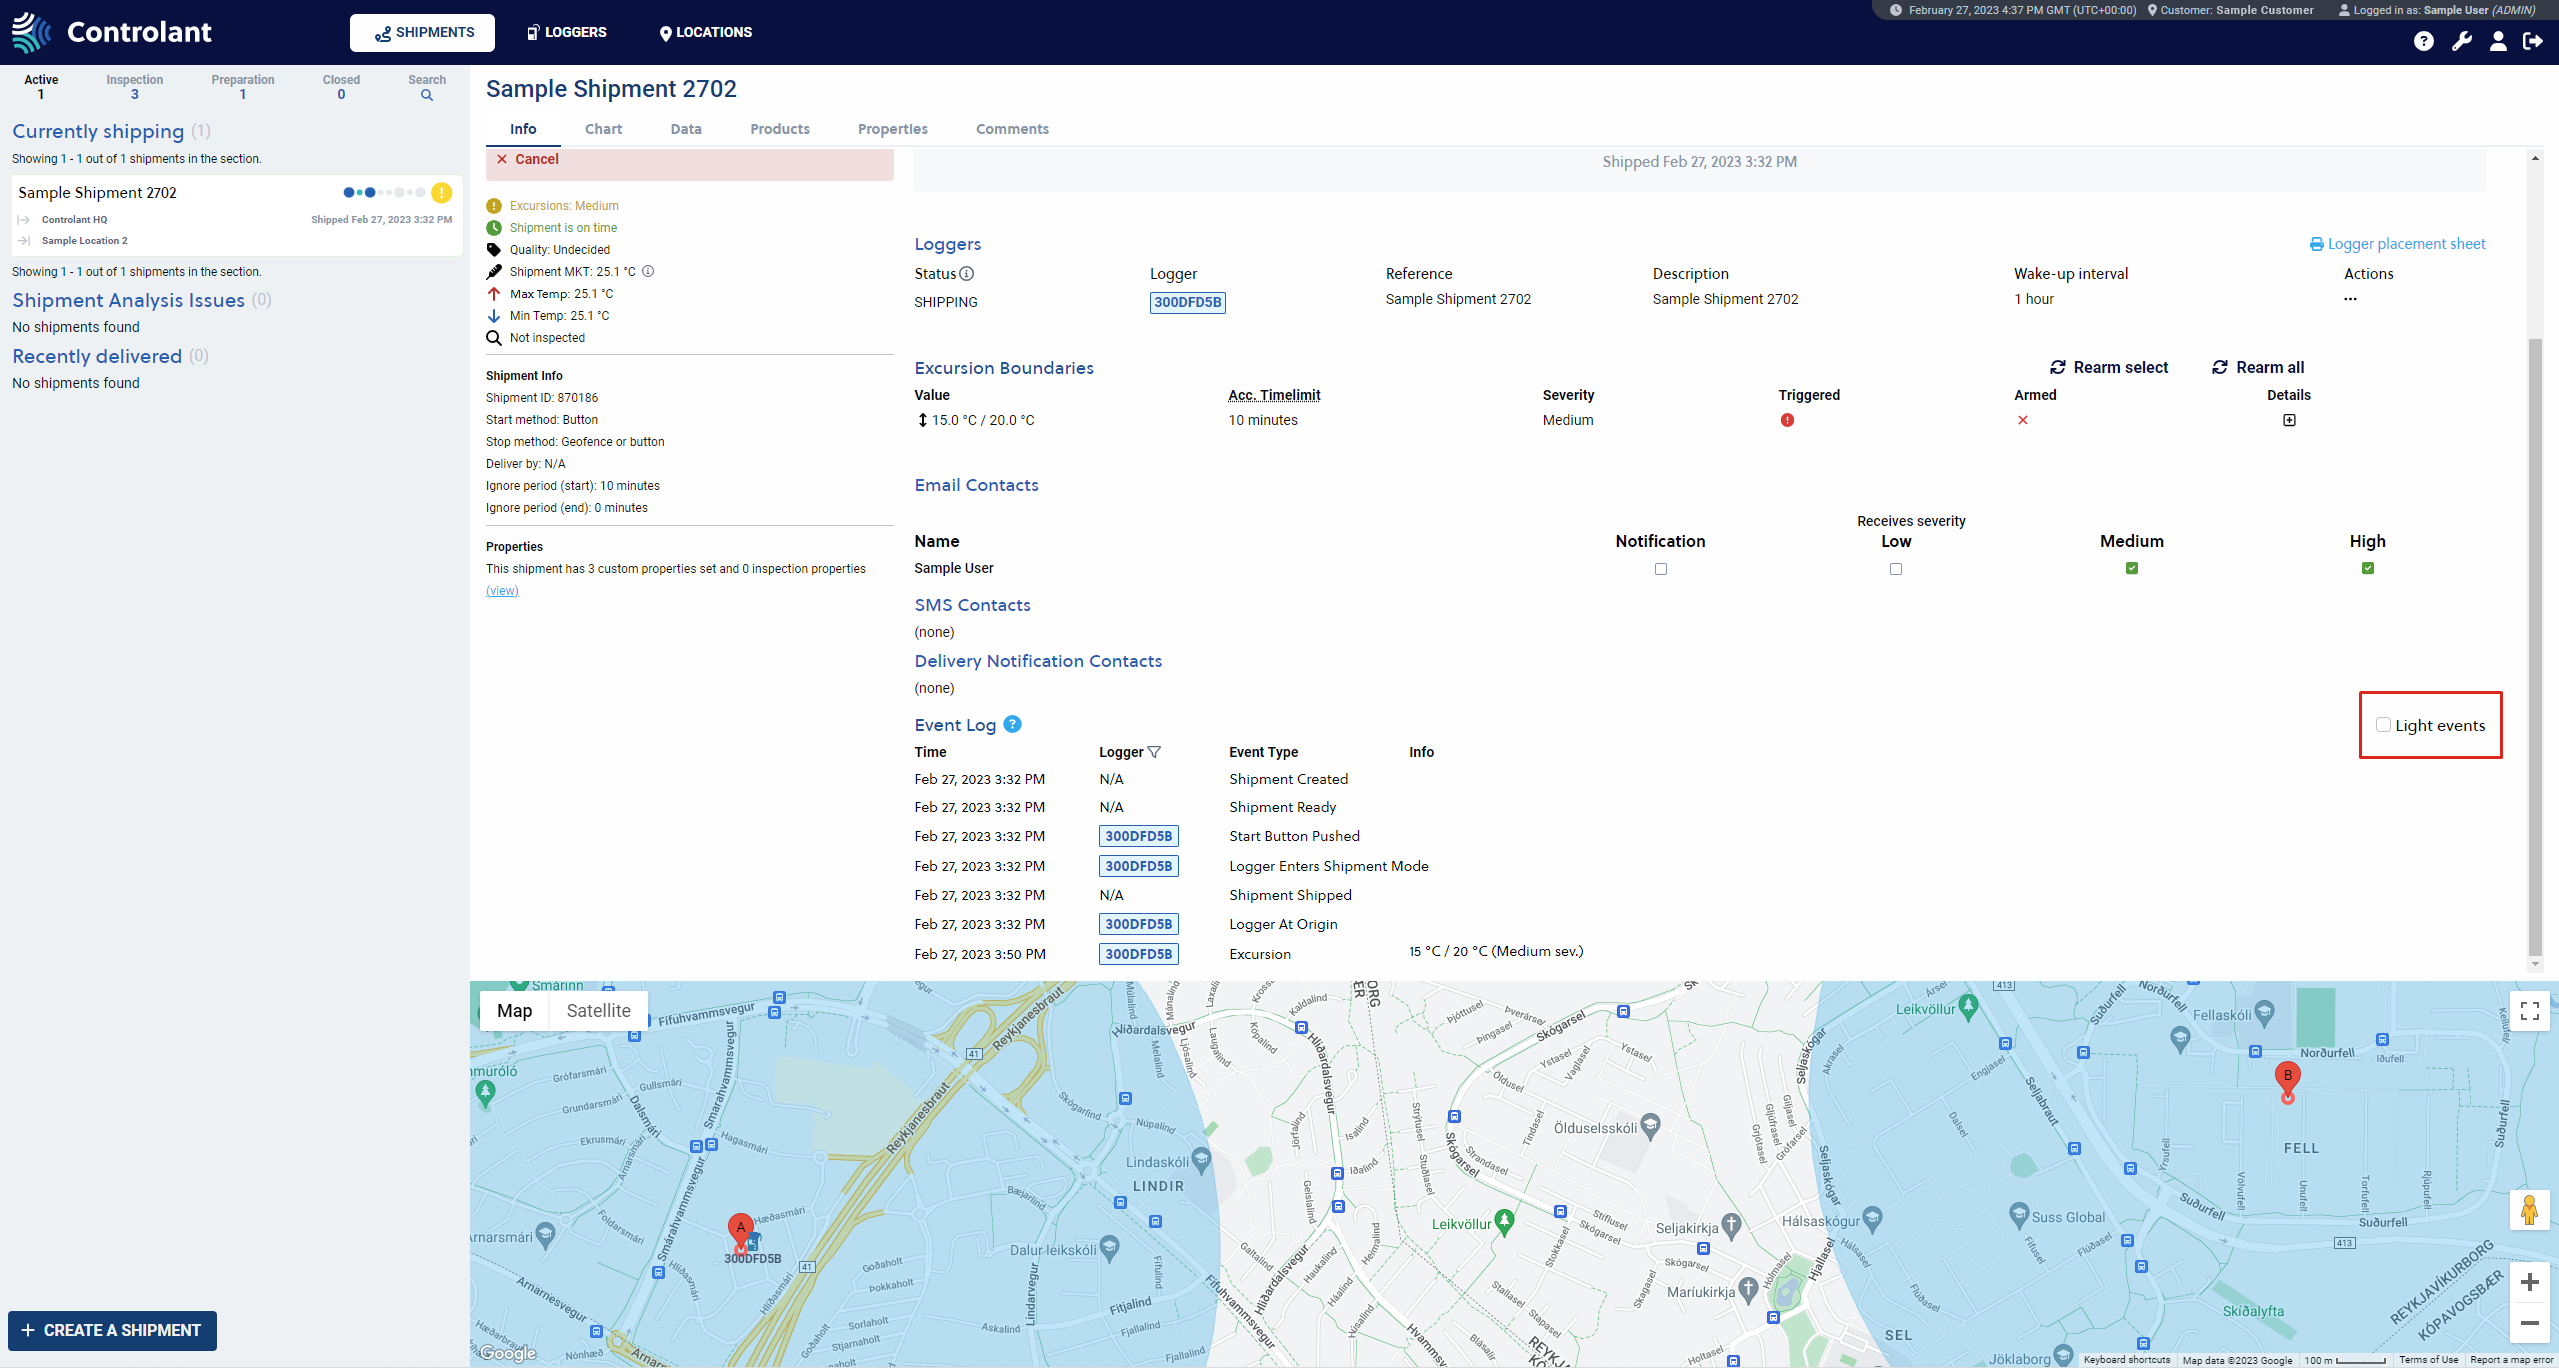 |
If Light events are displayed, they also appear in the chart under the Chart tab.
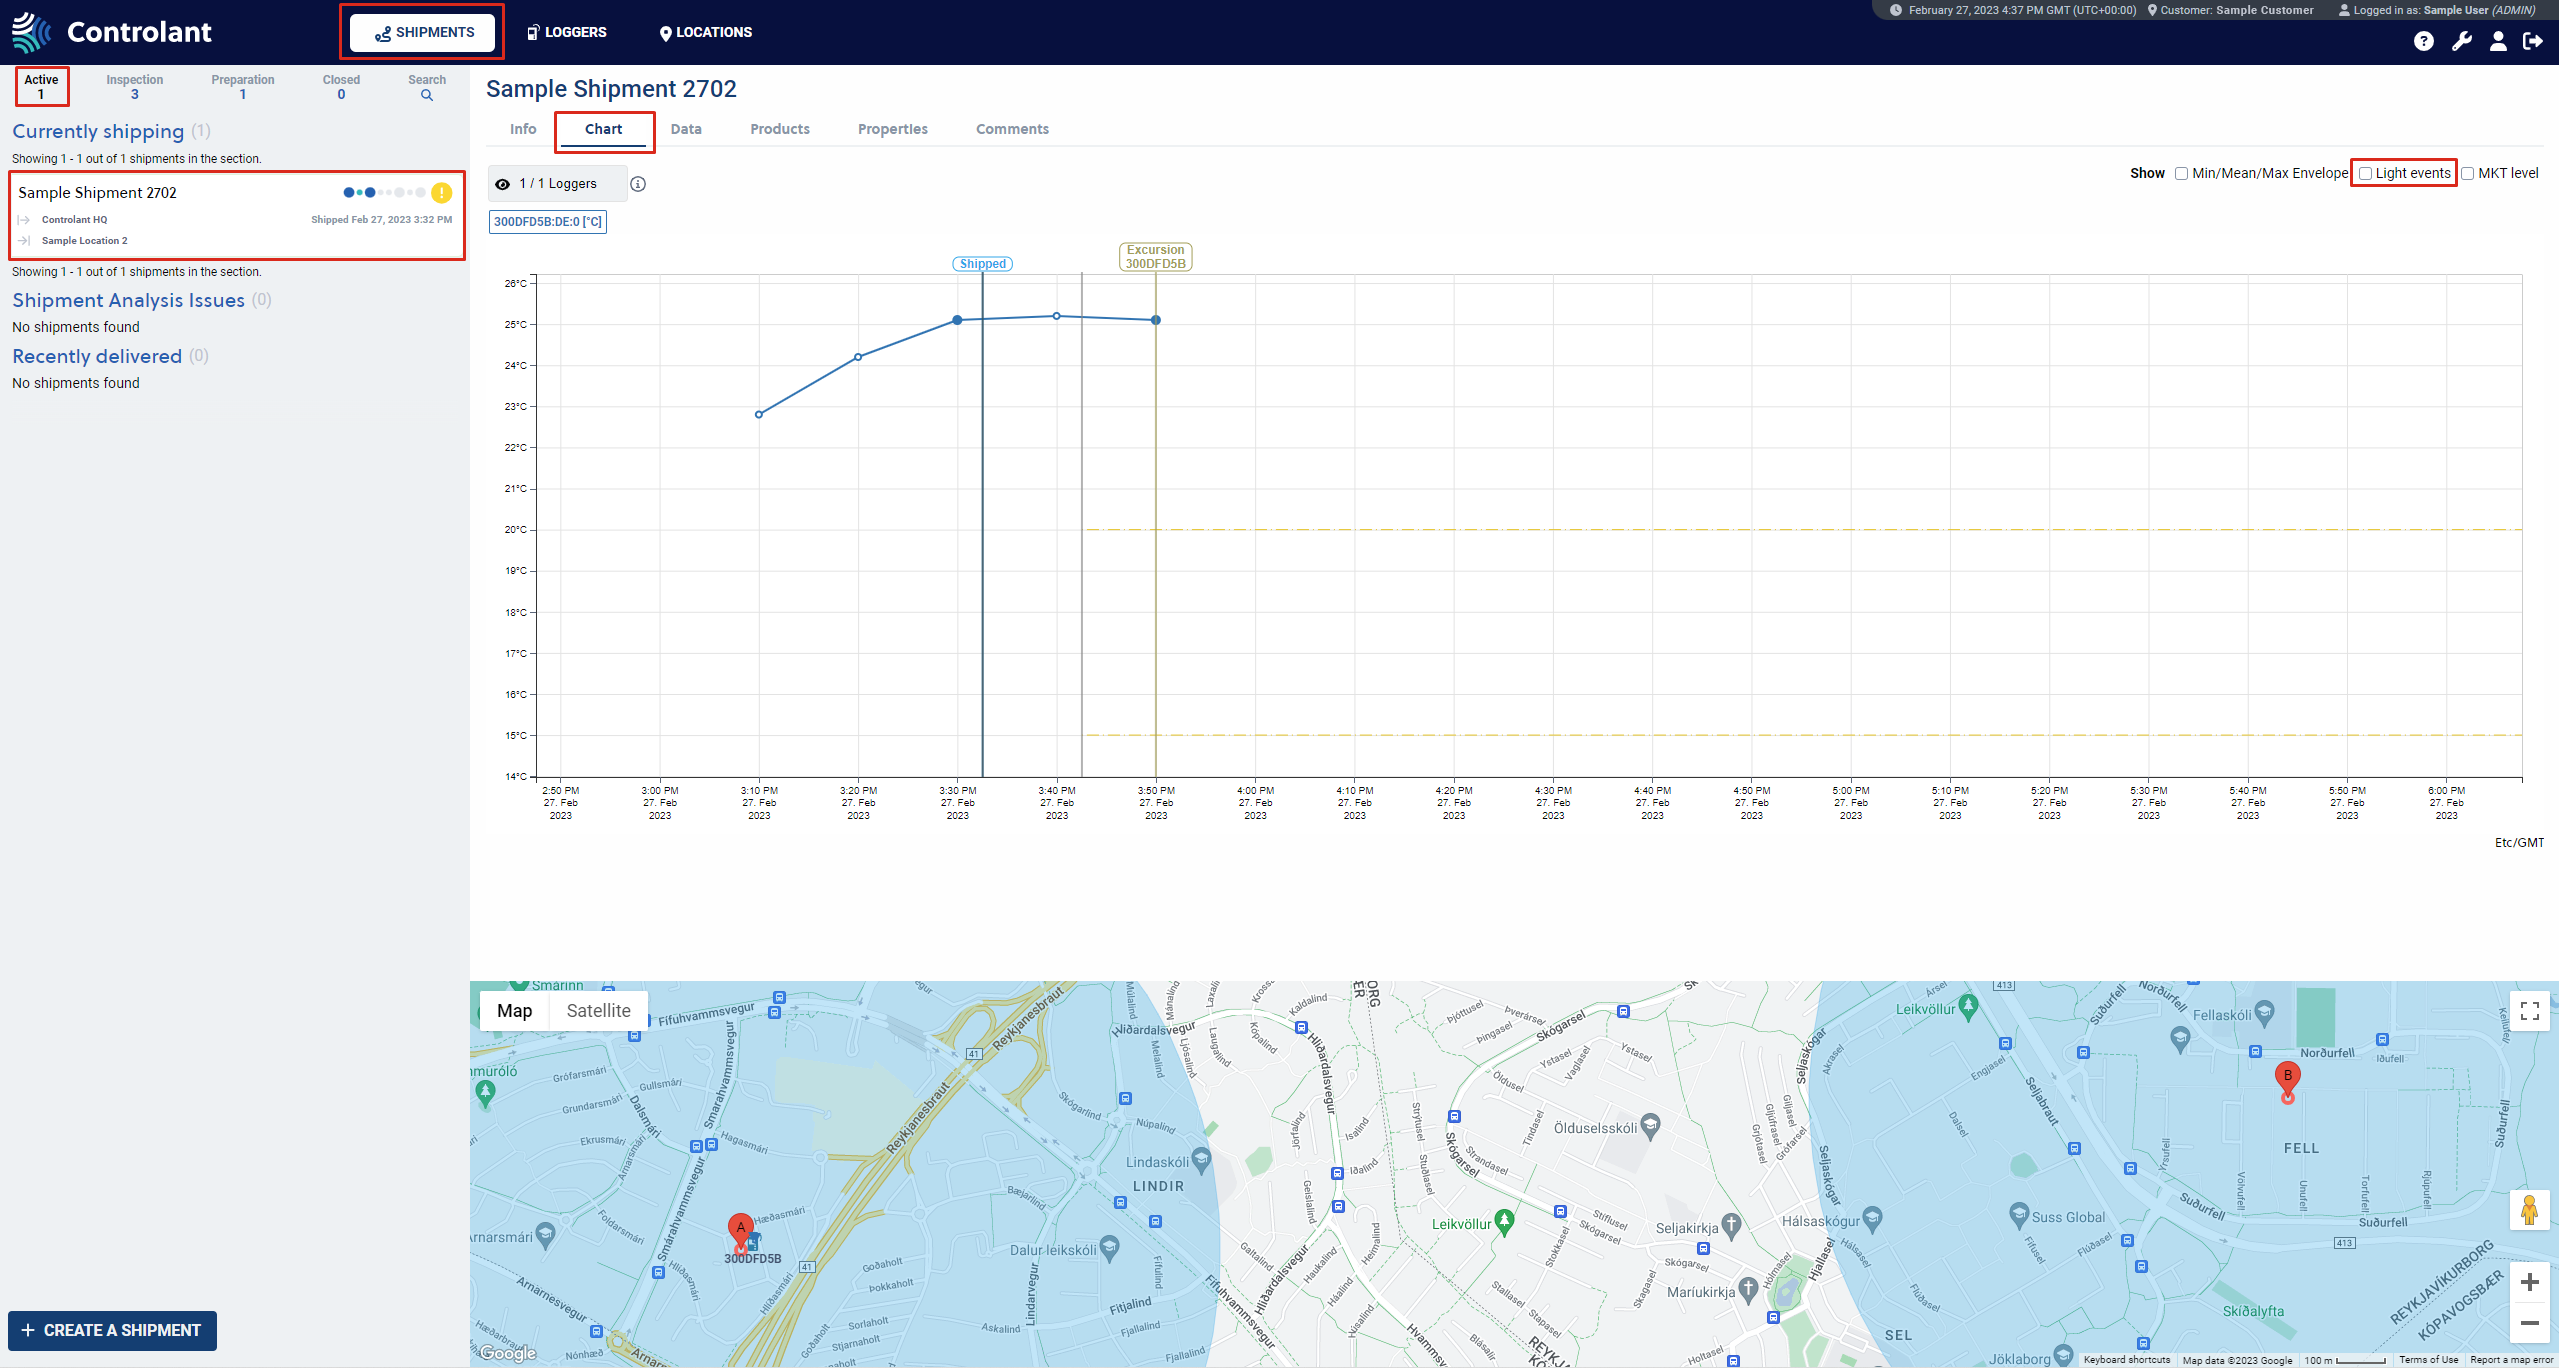 |
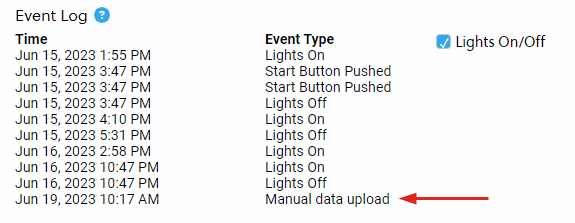
Manual Data Upload Events
You can also see manual data uploads in the event log if they happen.