Loggers view
Loggers view
Logger view
The Loggers tab presents a list of devices and a map of their locations.
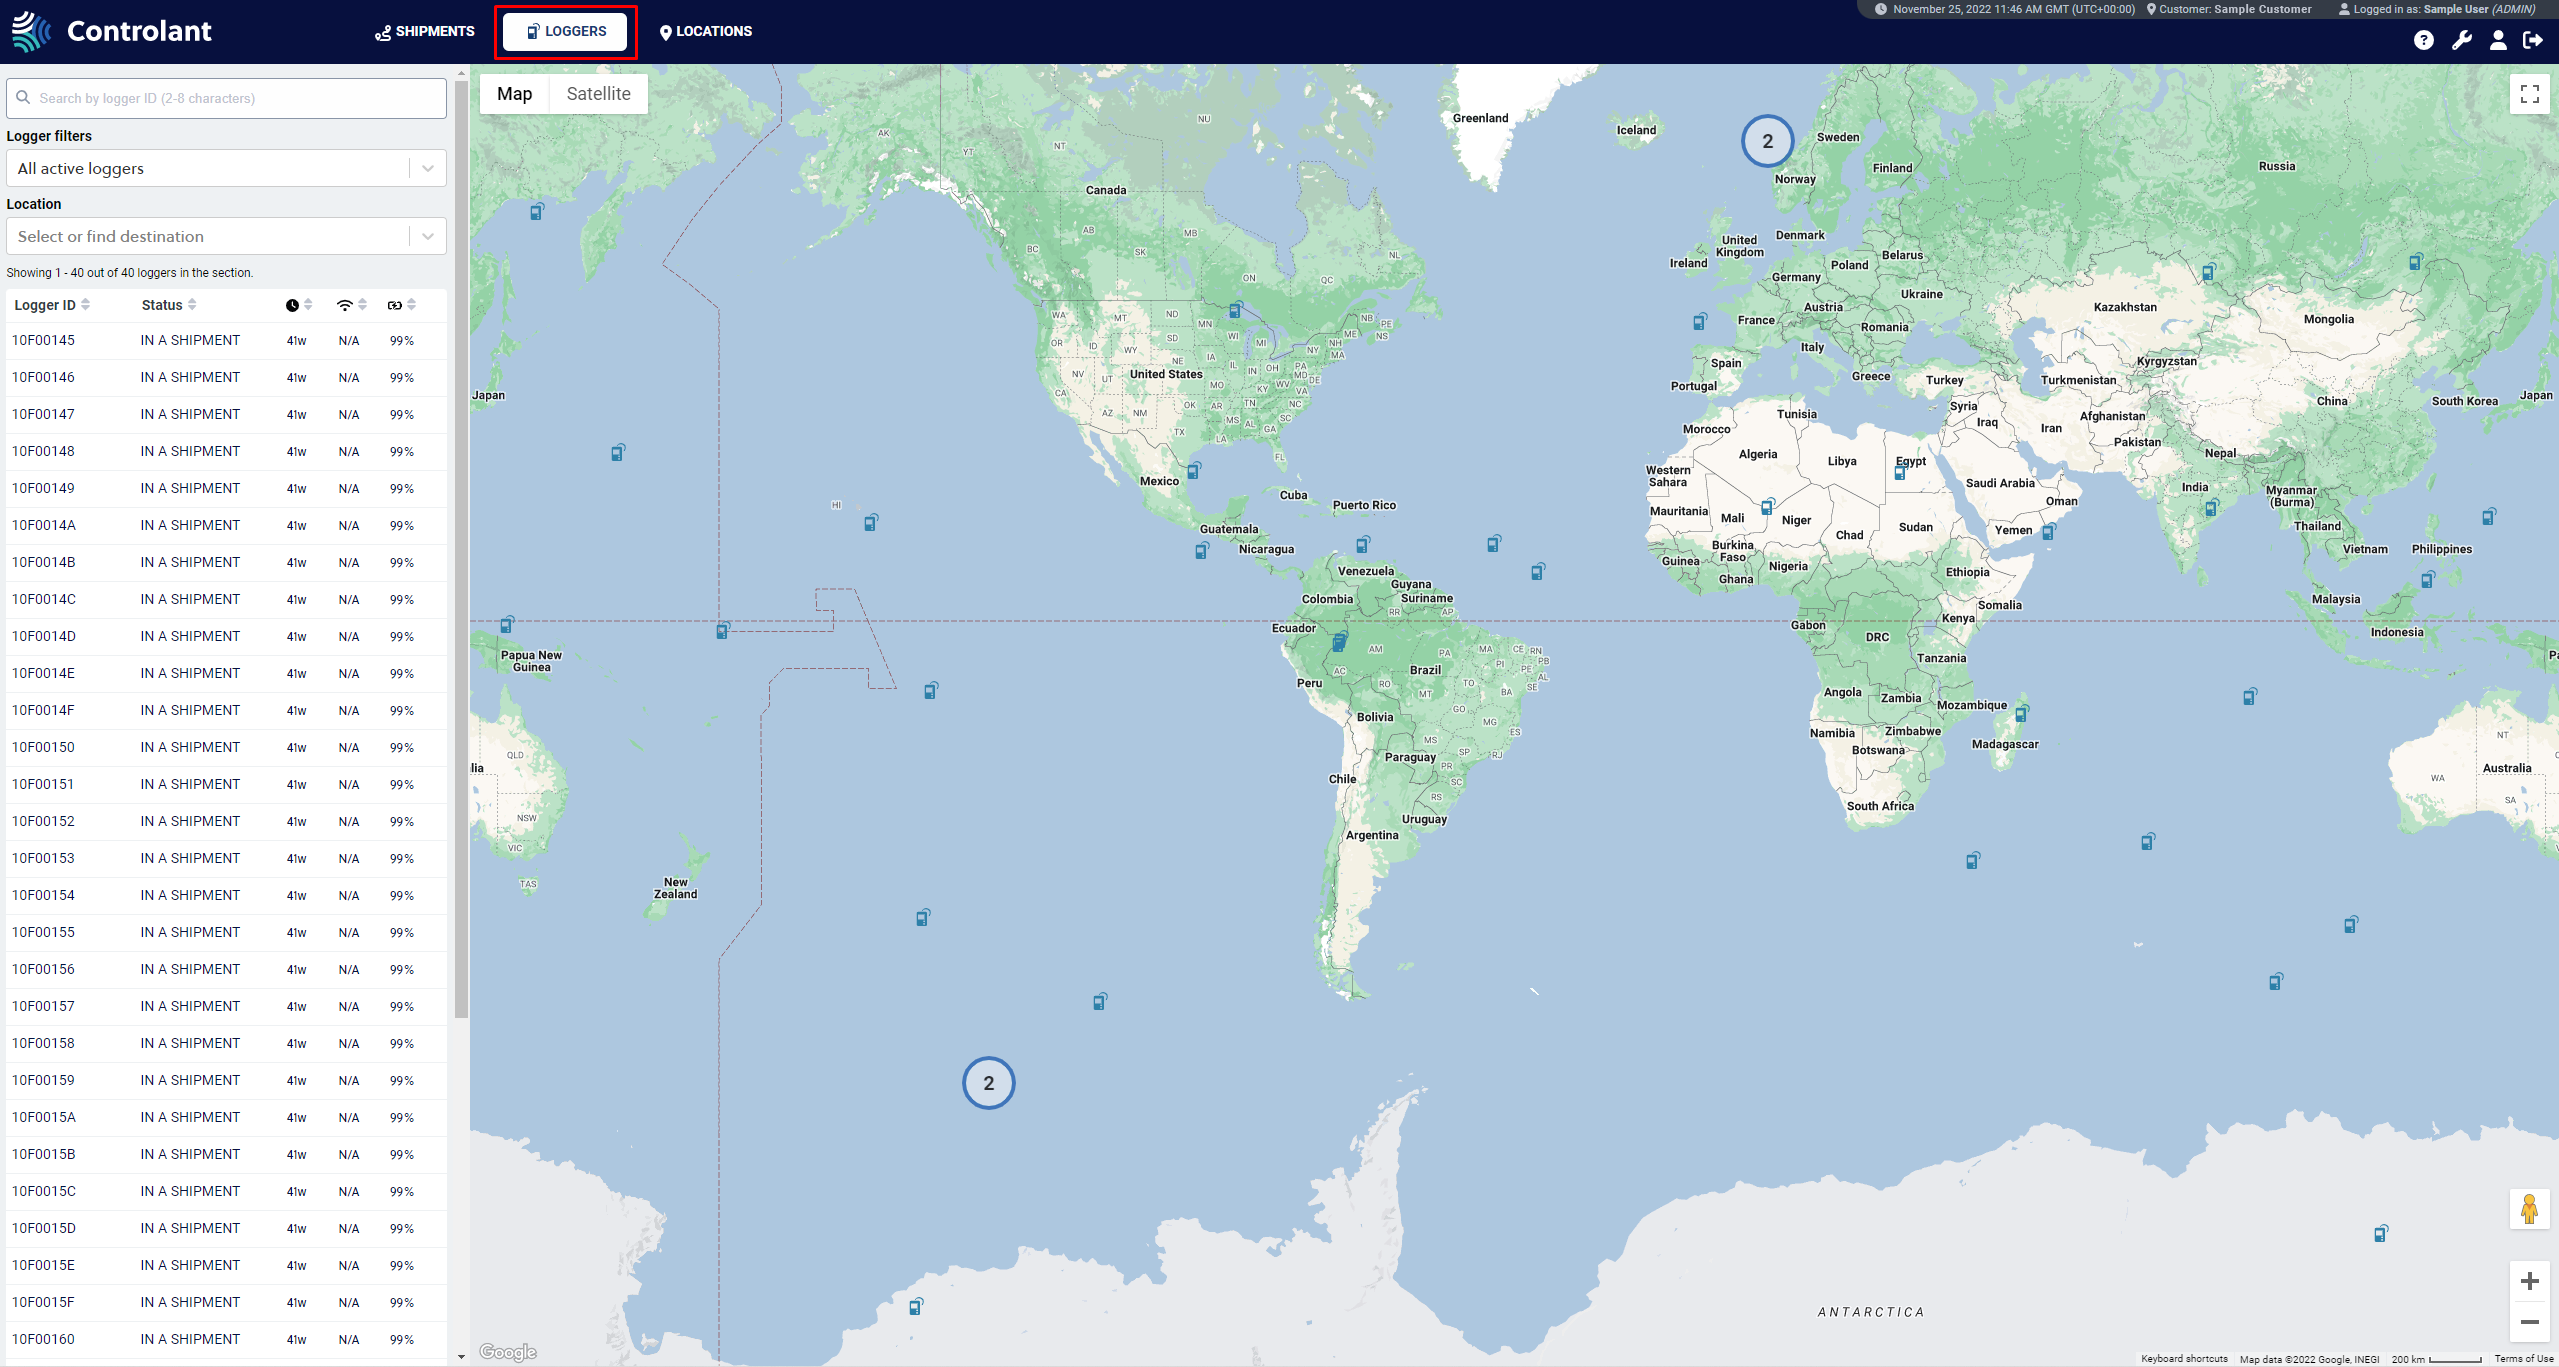 |
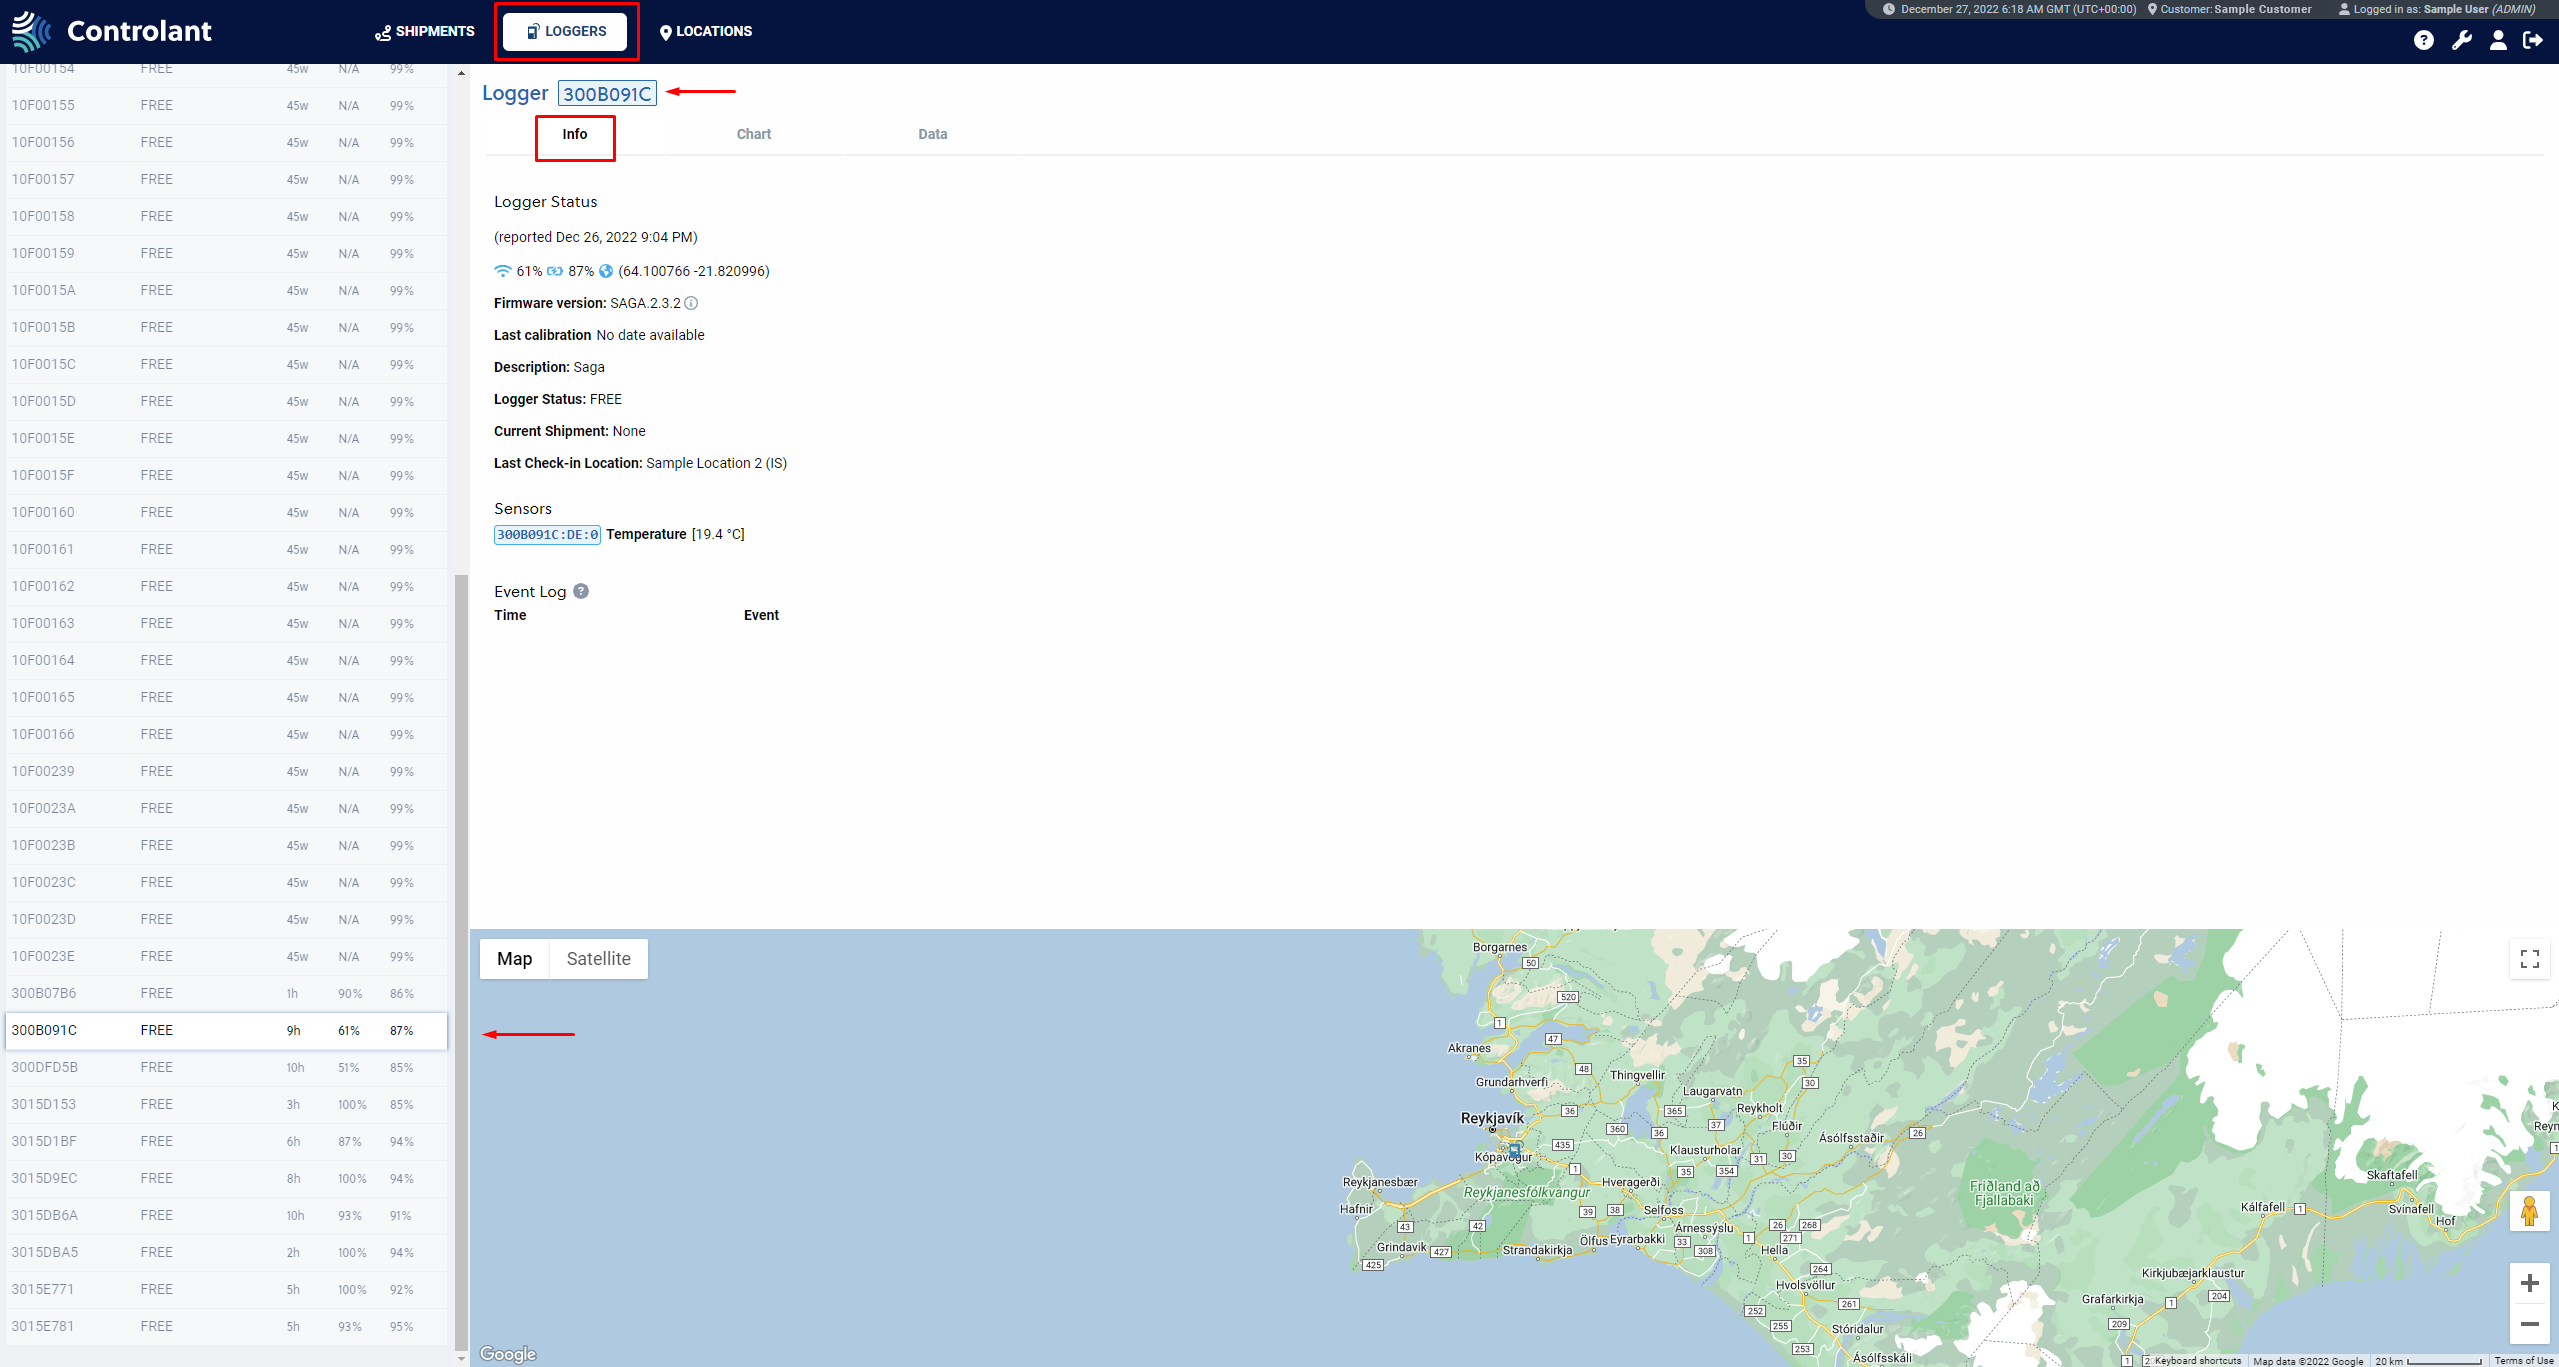
Once a user selects a single device in the loggers view , they will be presented with a single logger view.
The right side of the view is split into two parts. The top one shows device information, and the bottom one shows the device's location on a map.
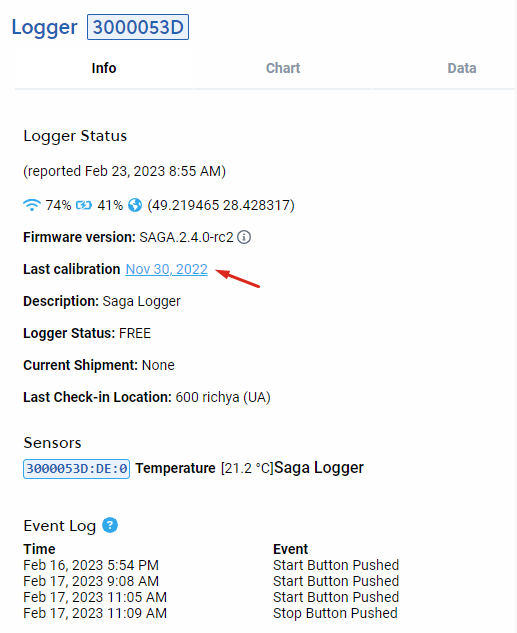
The top view has three tabs; the info tab shows information about the device, such as the Device ID, sensors, current shipment info, device status, firmware version (and updates pending), last known location, and coordinates for the last seven days, last 30 days, or Custom time gap (no more than 31 days).
The information displayed includes:
Item | Description |
|---|---|
(date last reported) | Date device last connected to the Controlant Cloud Platform, in |
(status) | Status of the device when it last connected:
|
Firmware version | Current firmware version of device. |
Last calibration | Date device was last calibrated, in |
Description | Type of device:
|
Logger Status | Status of device:
|
Current Shipment | Details about shipment, with link to shipment in Controlant Platform (SCM). |
Last Check-in Location | |
Logger Status (date last reported):
Network signal strength
Battery level
Location, in ([latitude], [longitude]) format.
Firmware version
Last calibration (date and link to the Calibration Certificate when available)
Description of device
Logger Status: Status of device
Current Shipment
Last Check-in Location
Sensors
Event log
Time
Event
 |
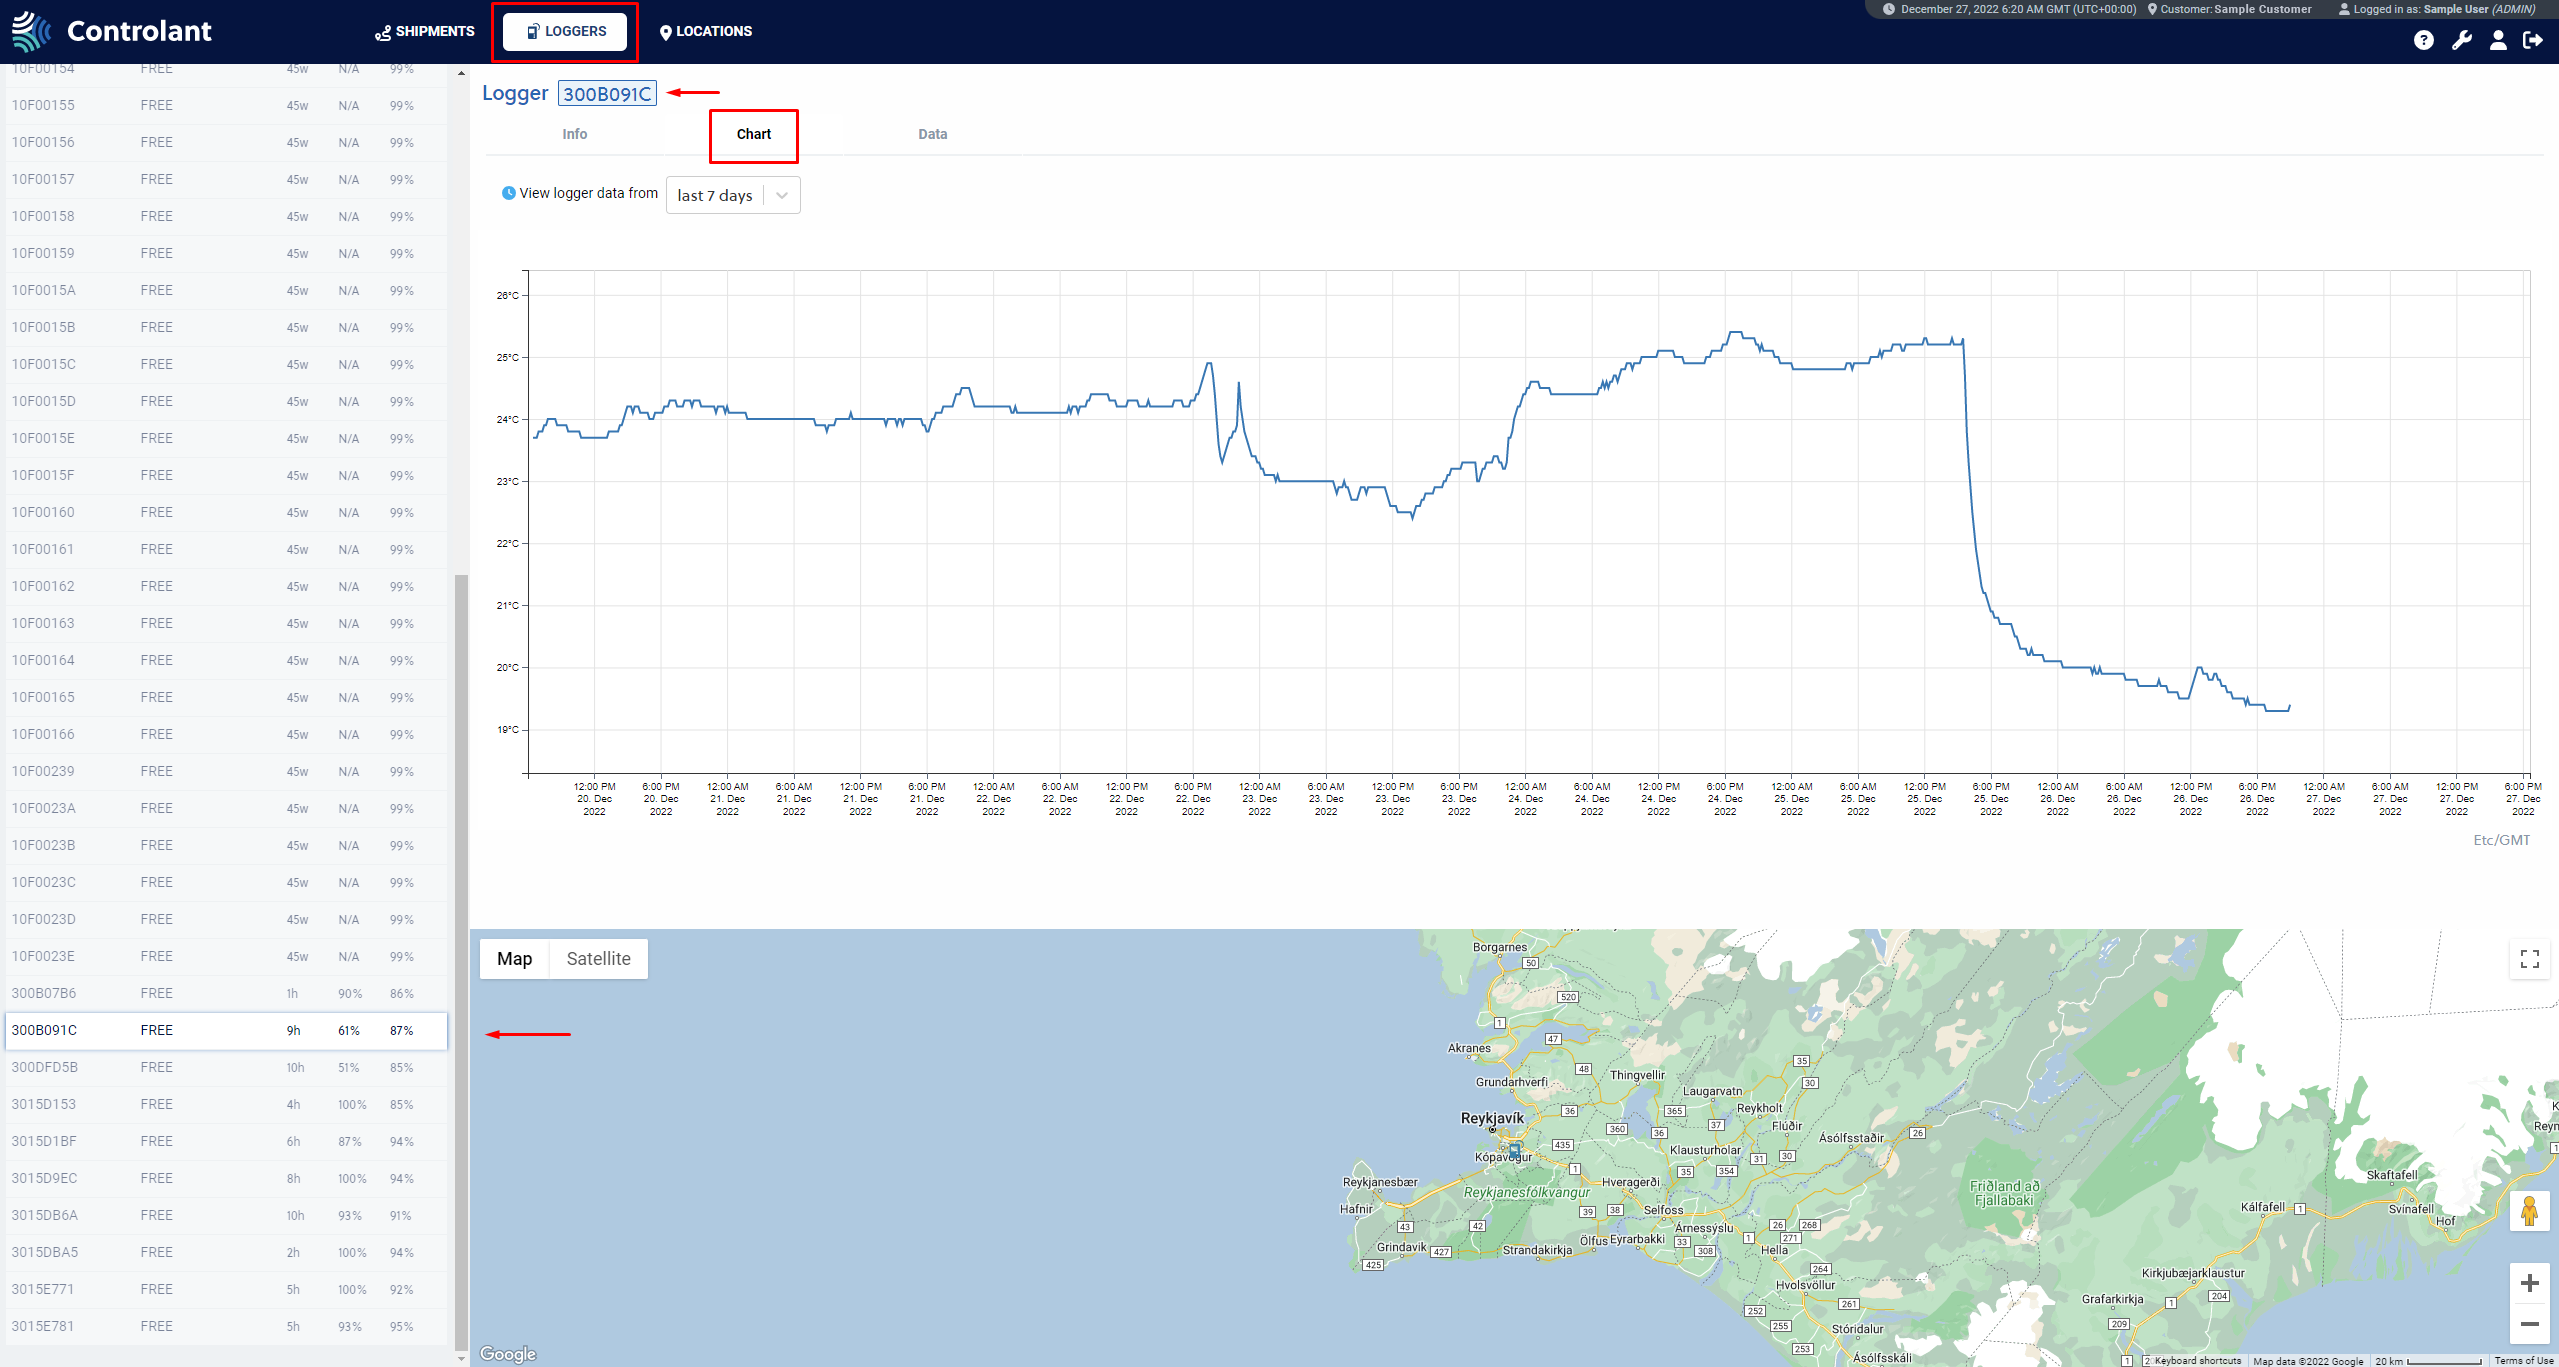
The chart tab shows a temperature graph for the last seven days, 30 days, or a custom time gap (no more than 31 days).
 |
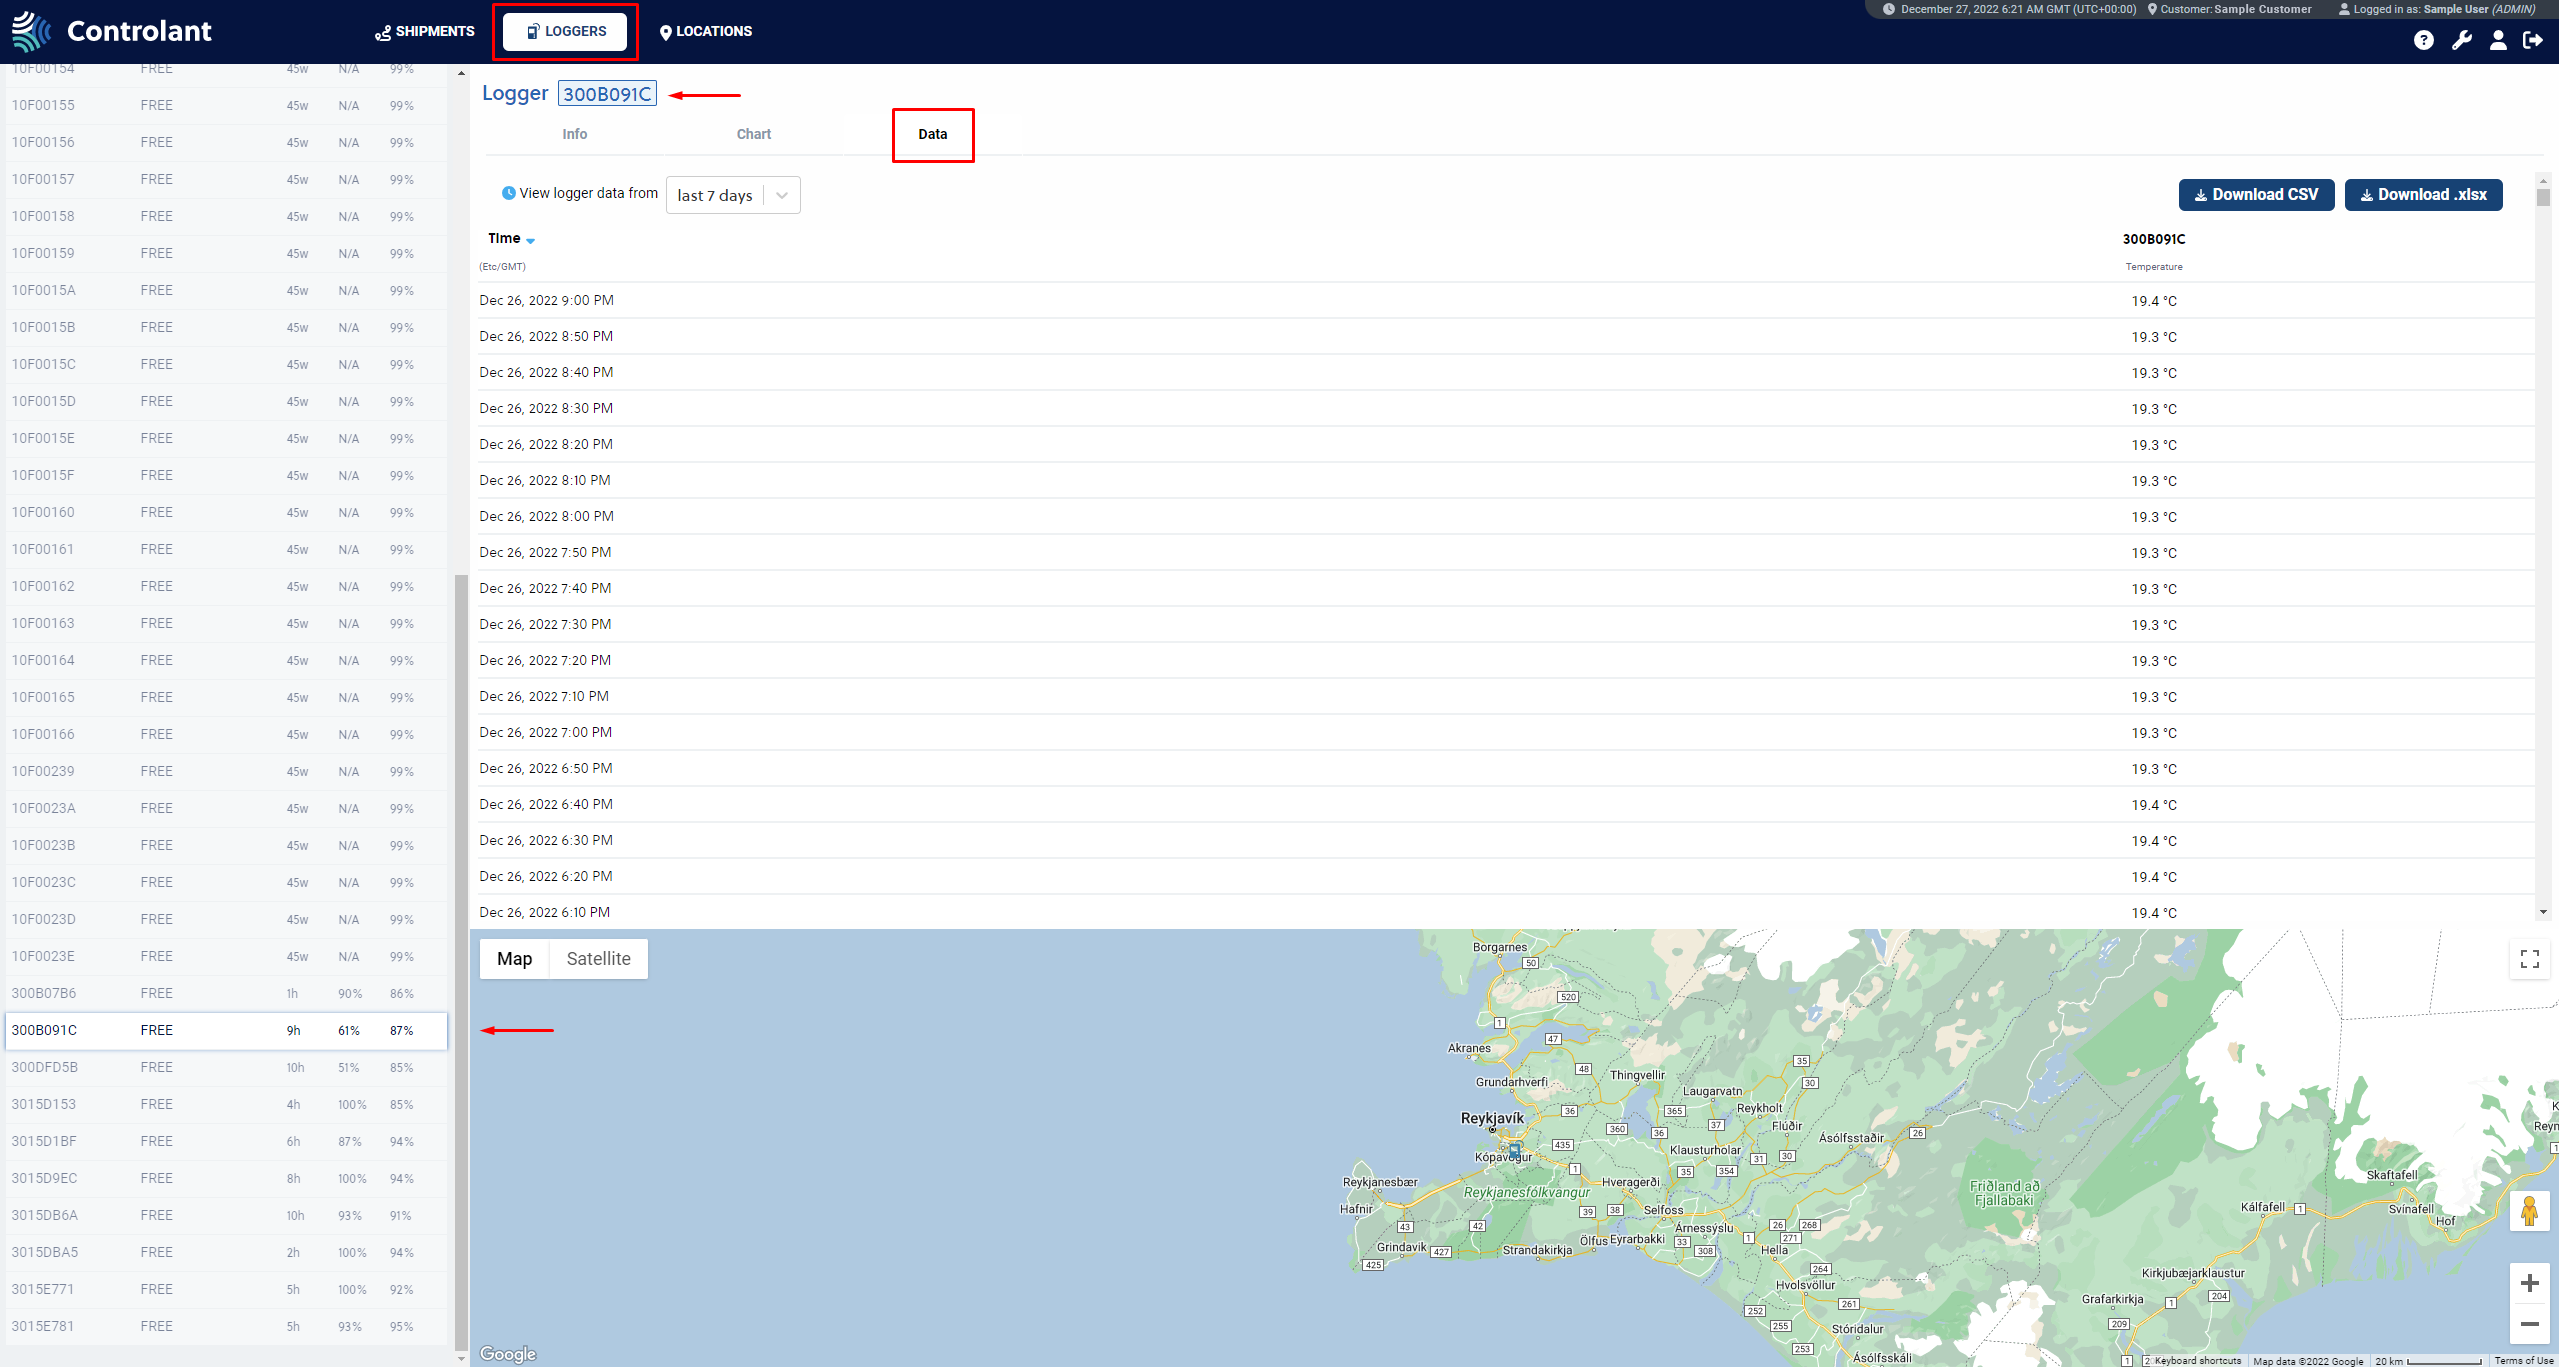
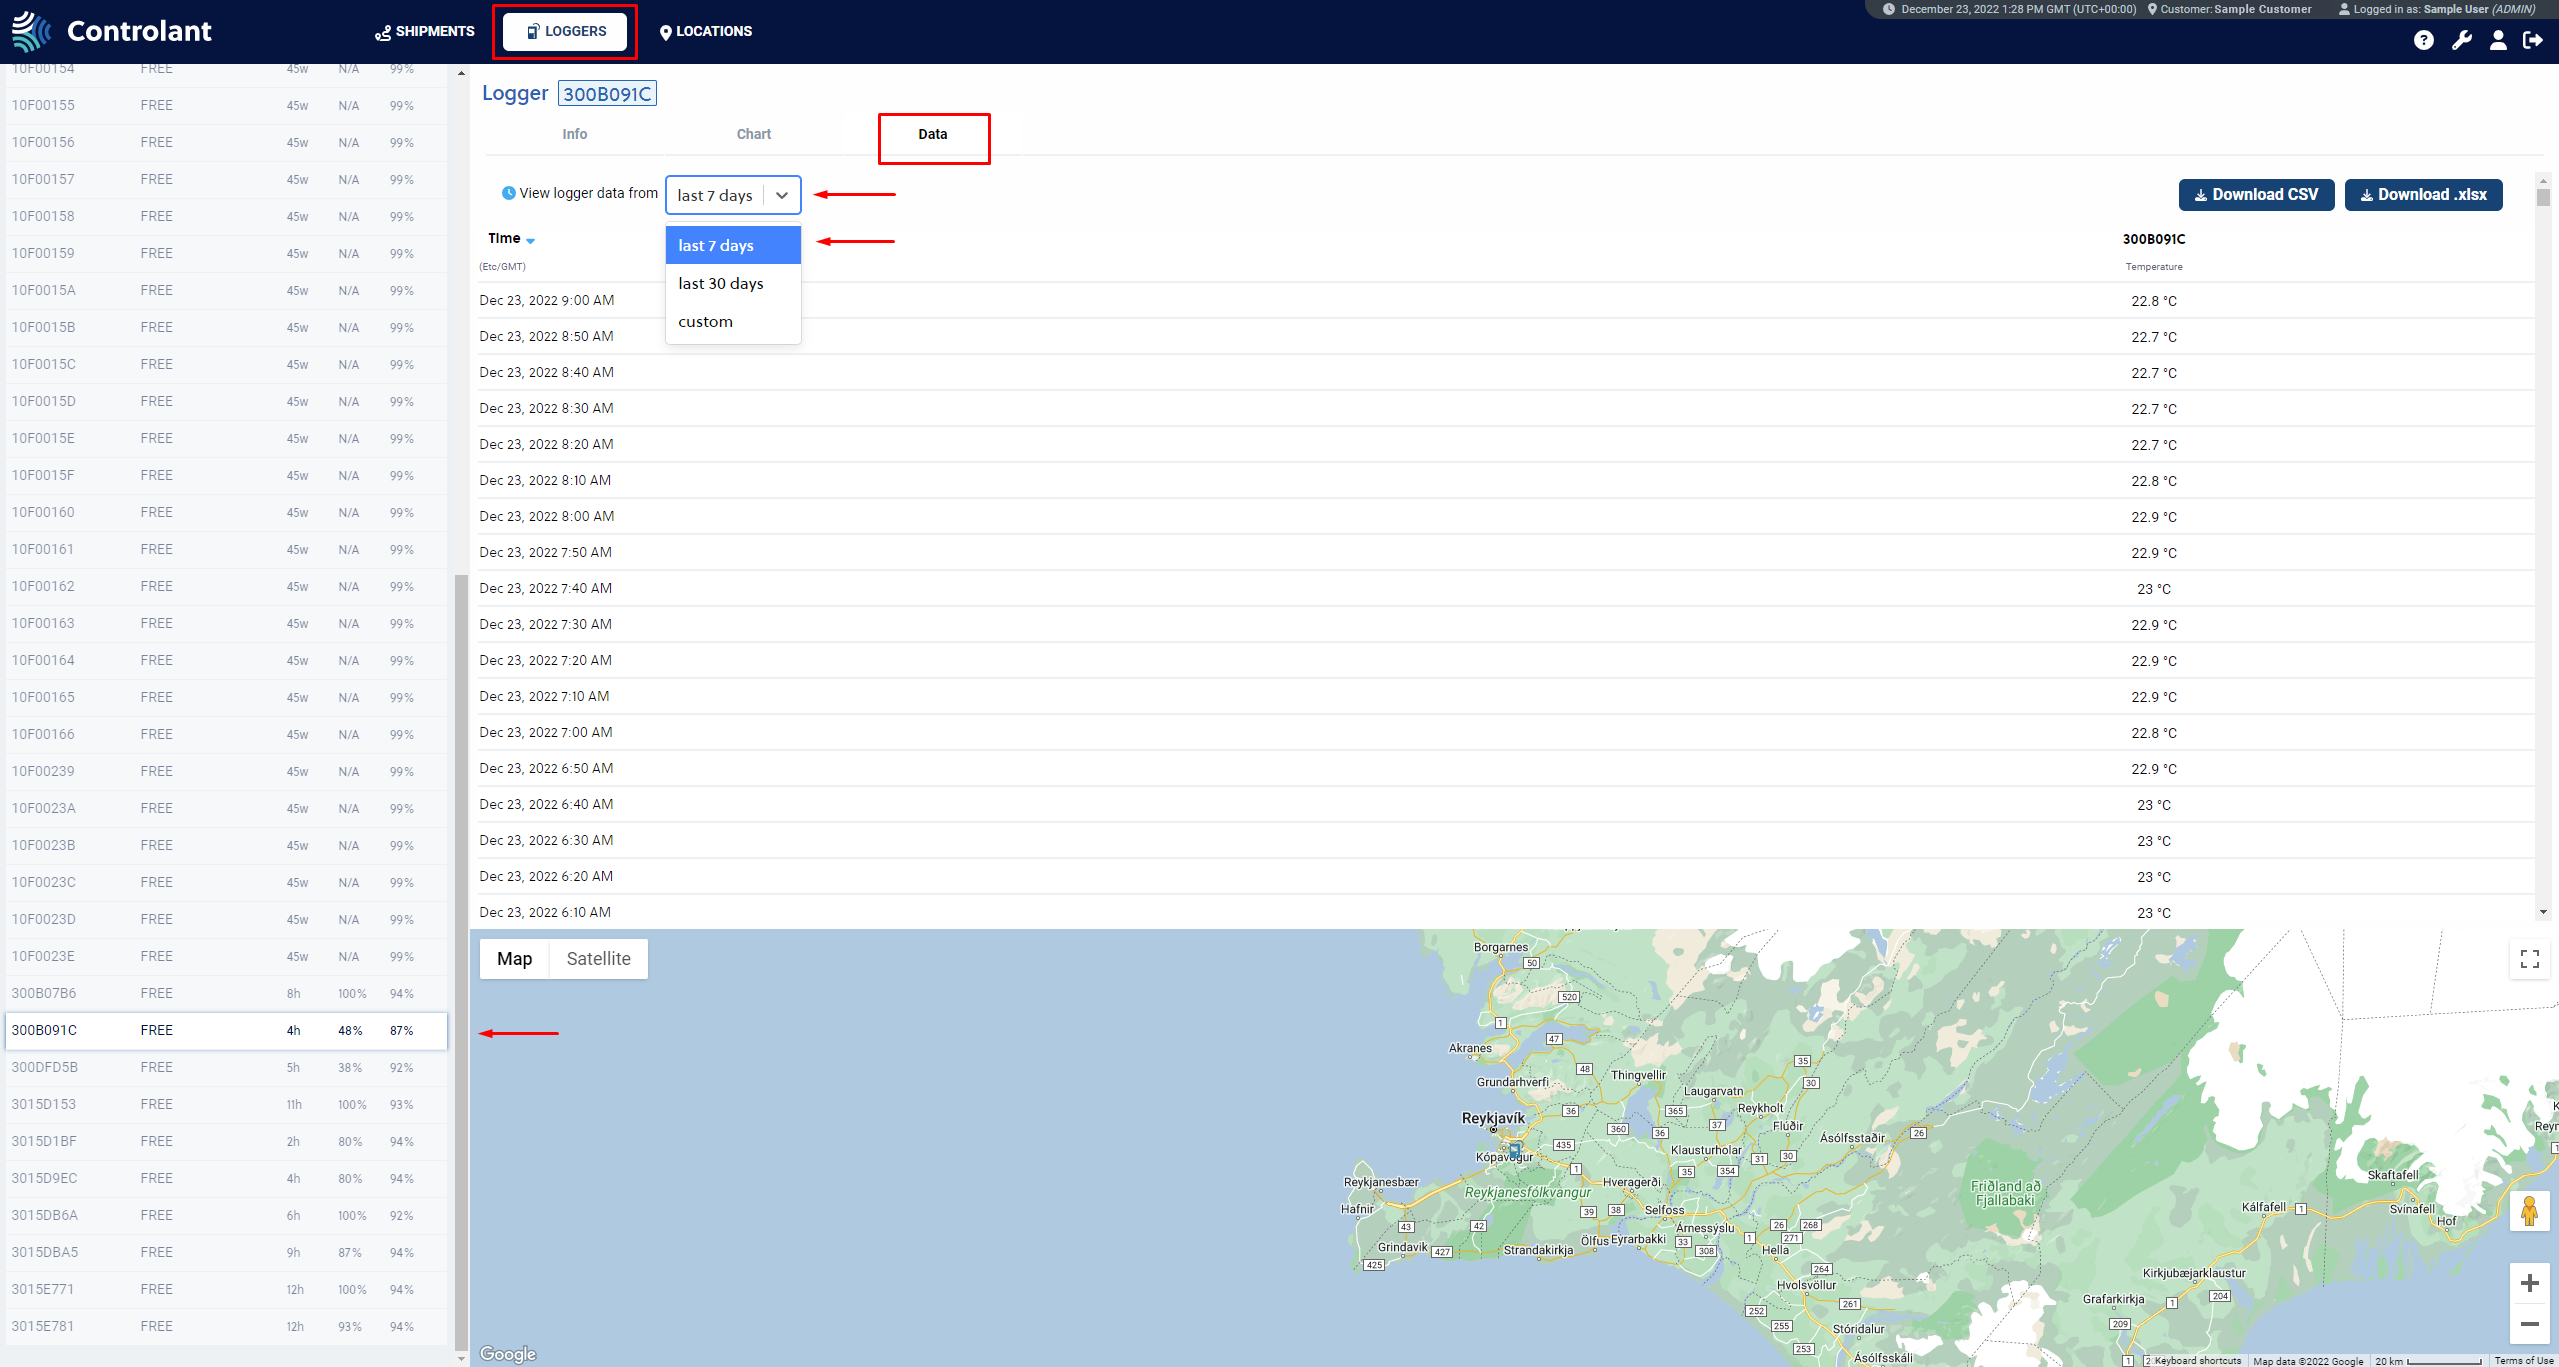
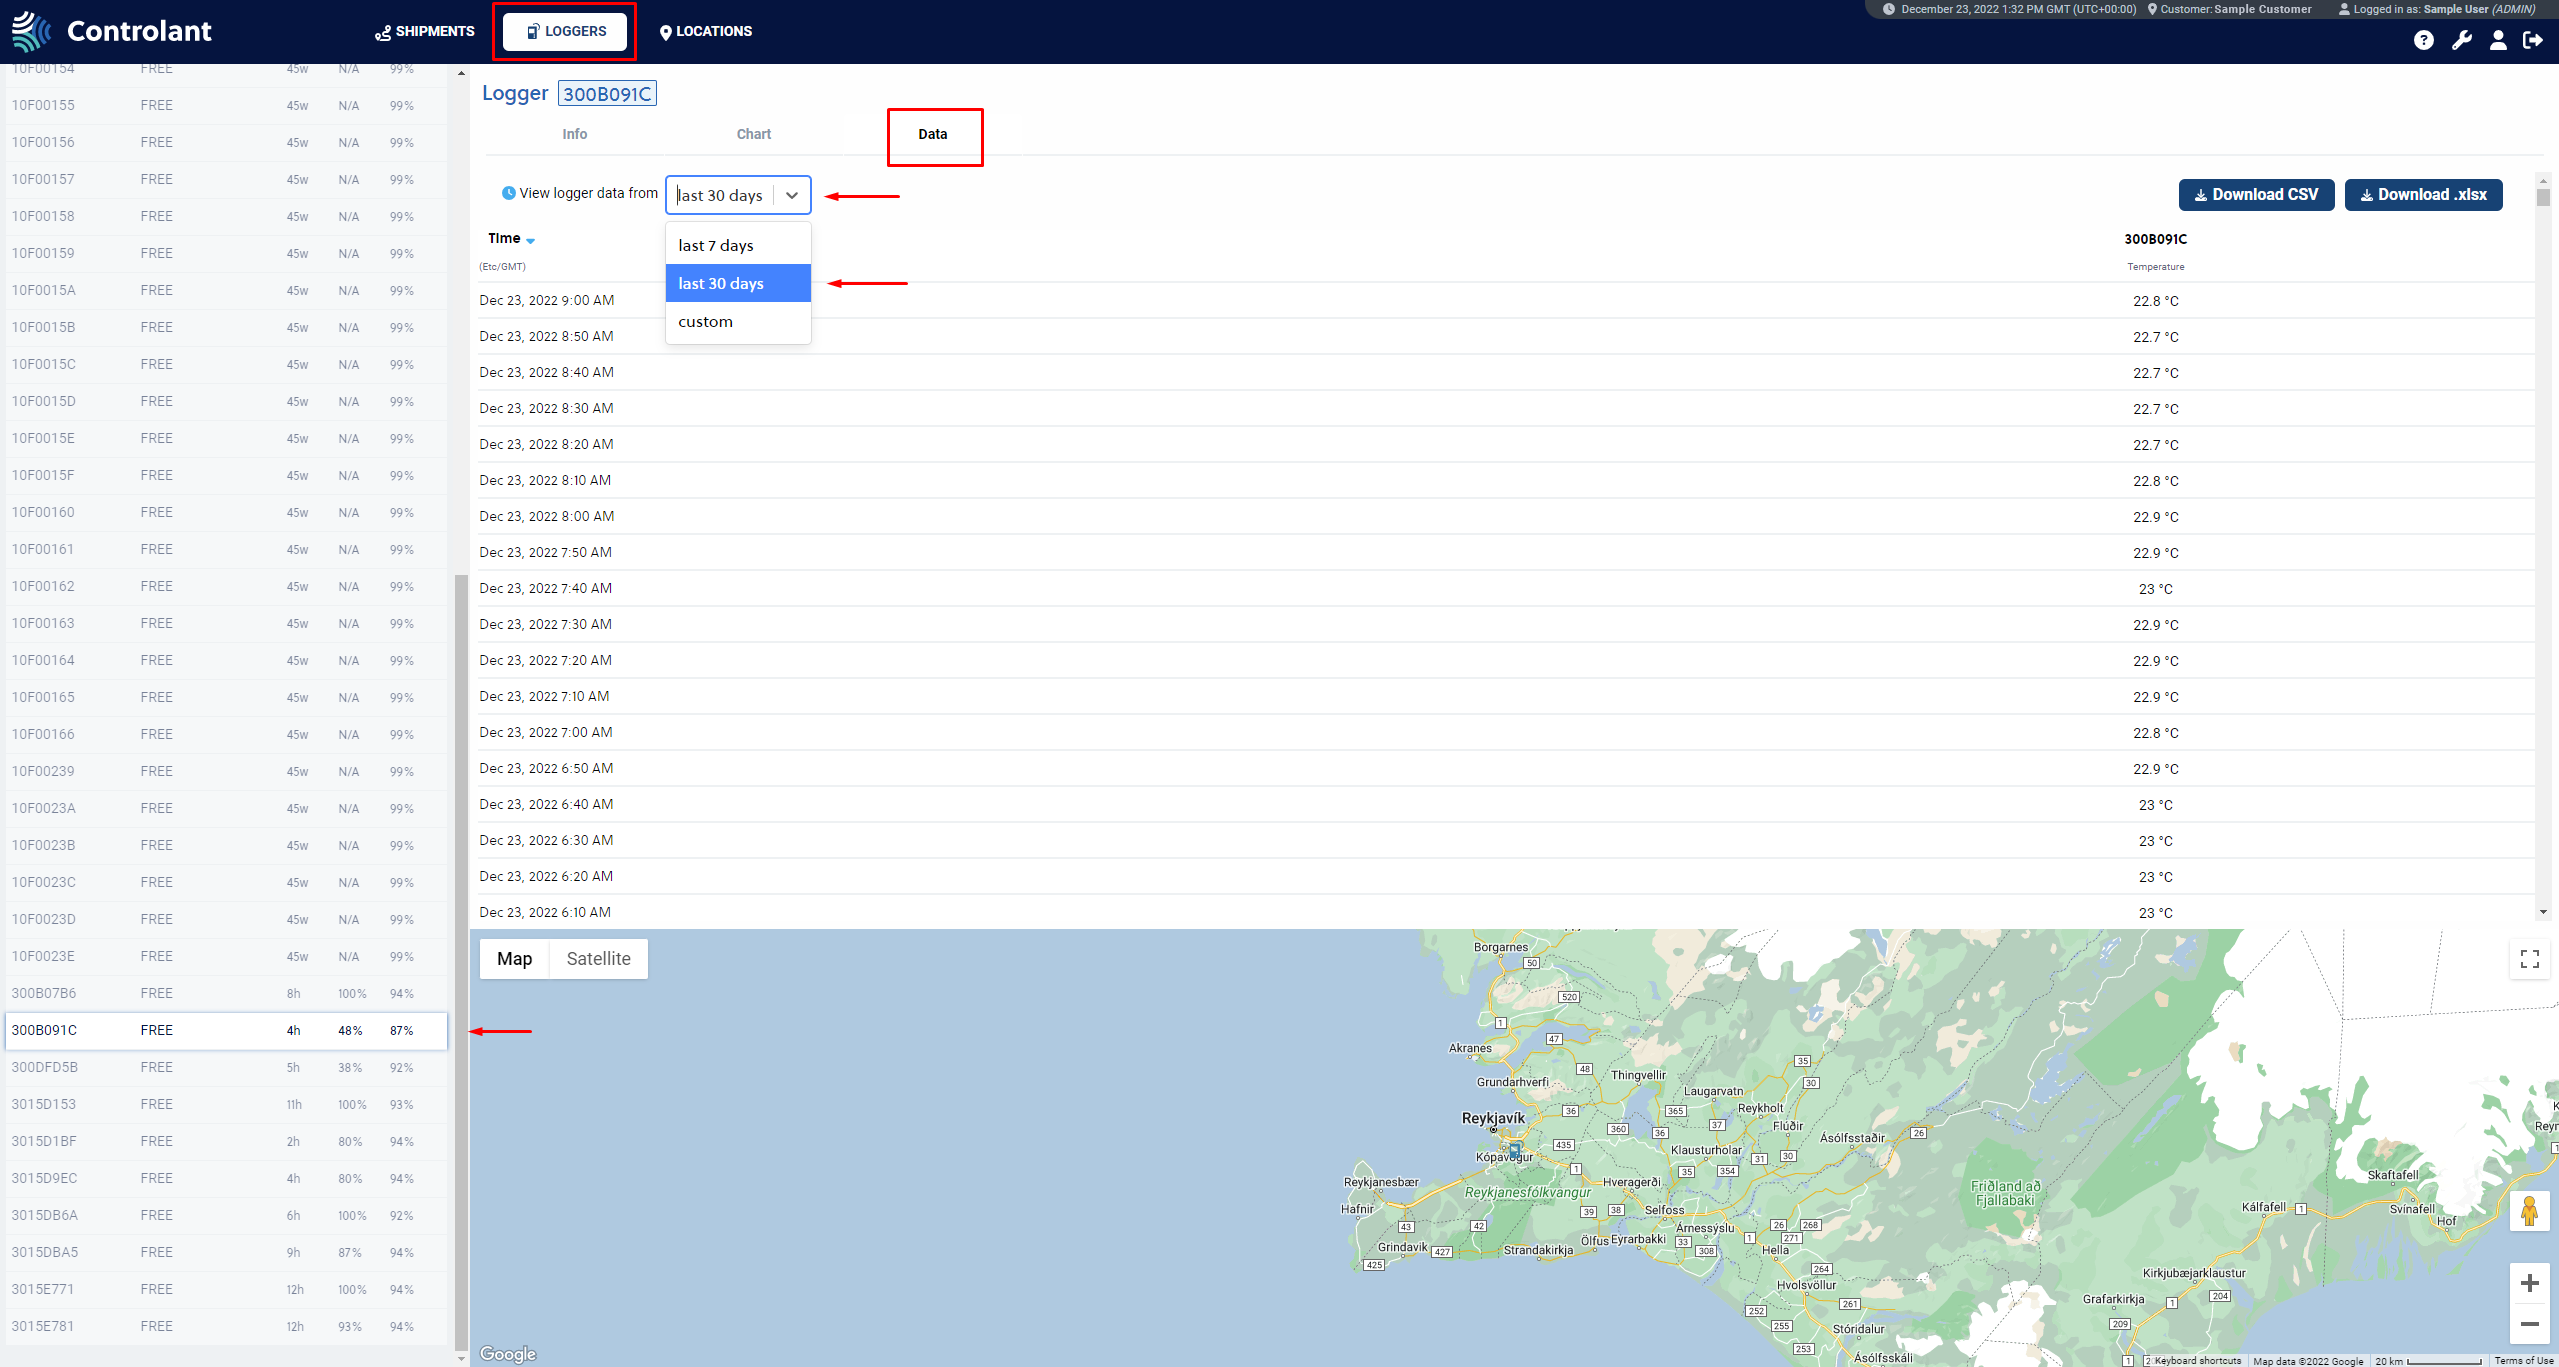
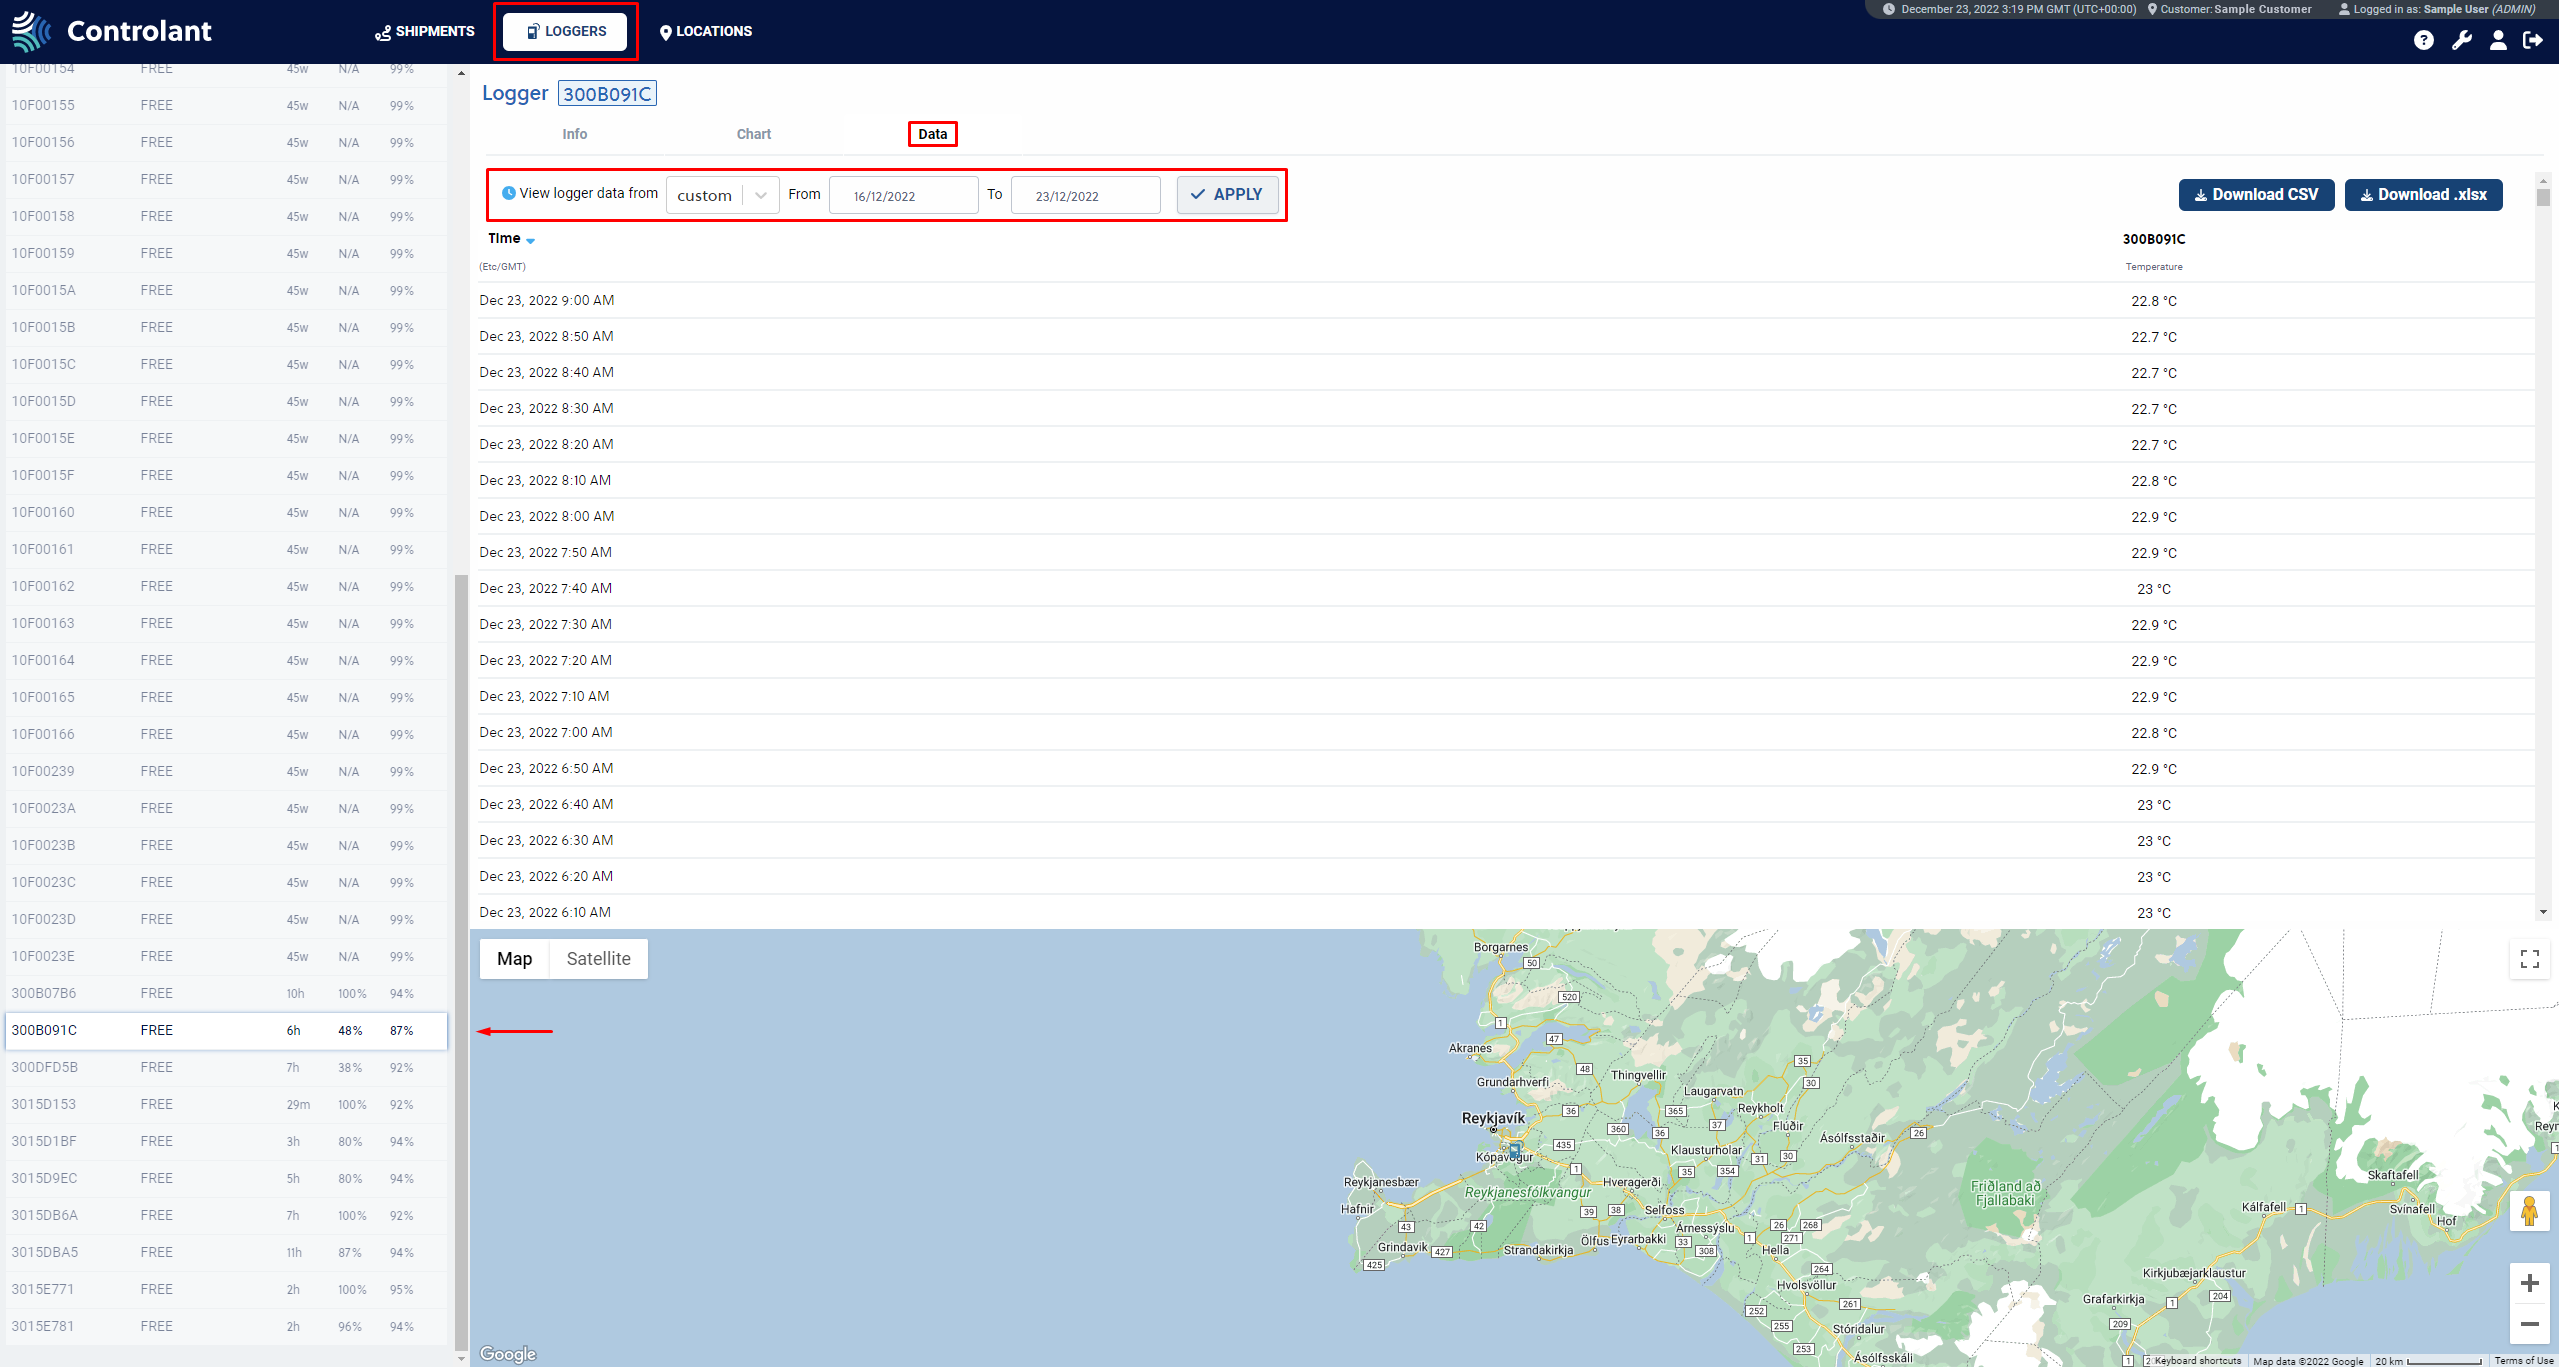
The data tab shows us the temperature measurements for the last seven days, the 30 days, or a custom time gap (no more than 31 days) that the temperature graph in the chart tab uses. These measurements can be viewed in the user interface, downloaded as an excel sheet by pressing the download TSW (Excel) button, or as a CSV file by pressing the download CSV button. The location of the measurement will be displayed on the bottom view map by clicking on the globe next to some measurements.
 |
 |
 |
 |
Filter
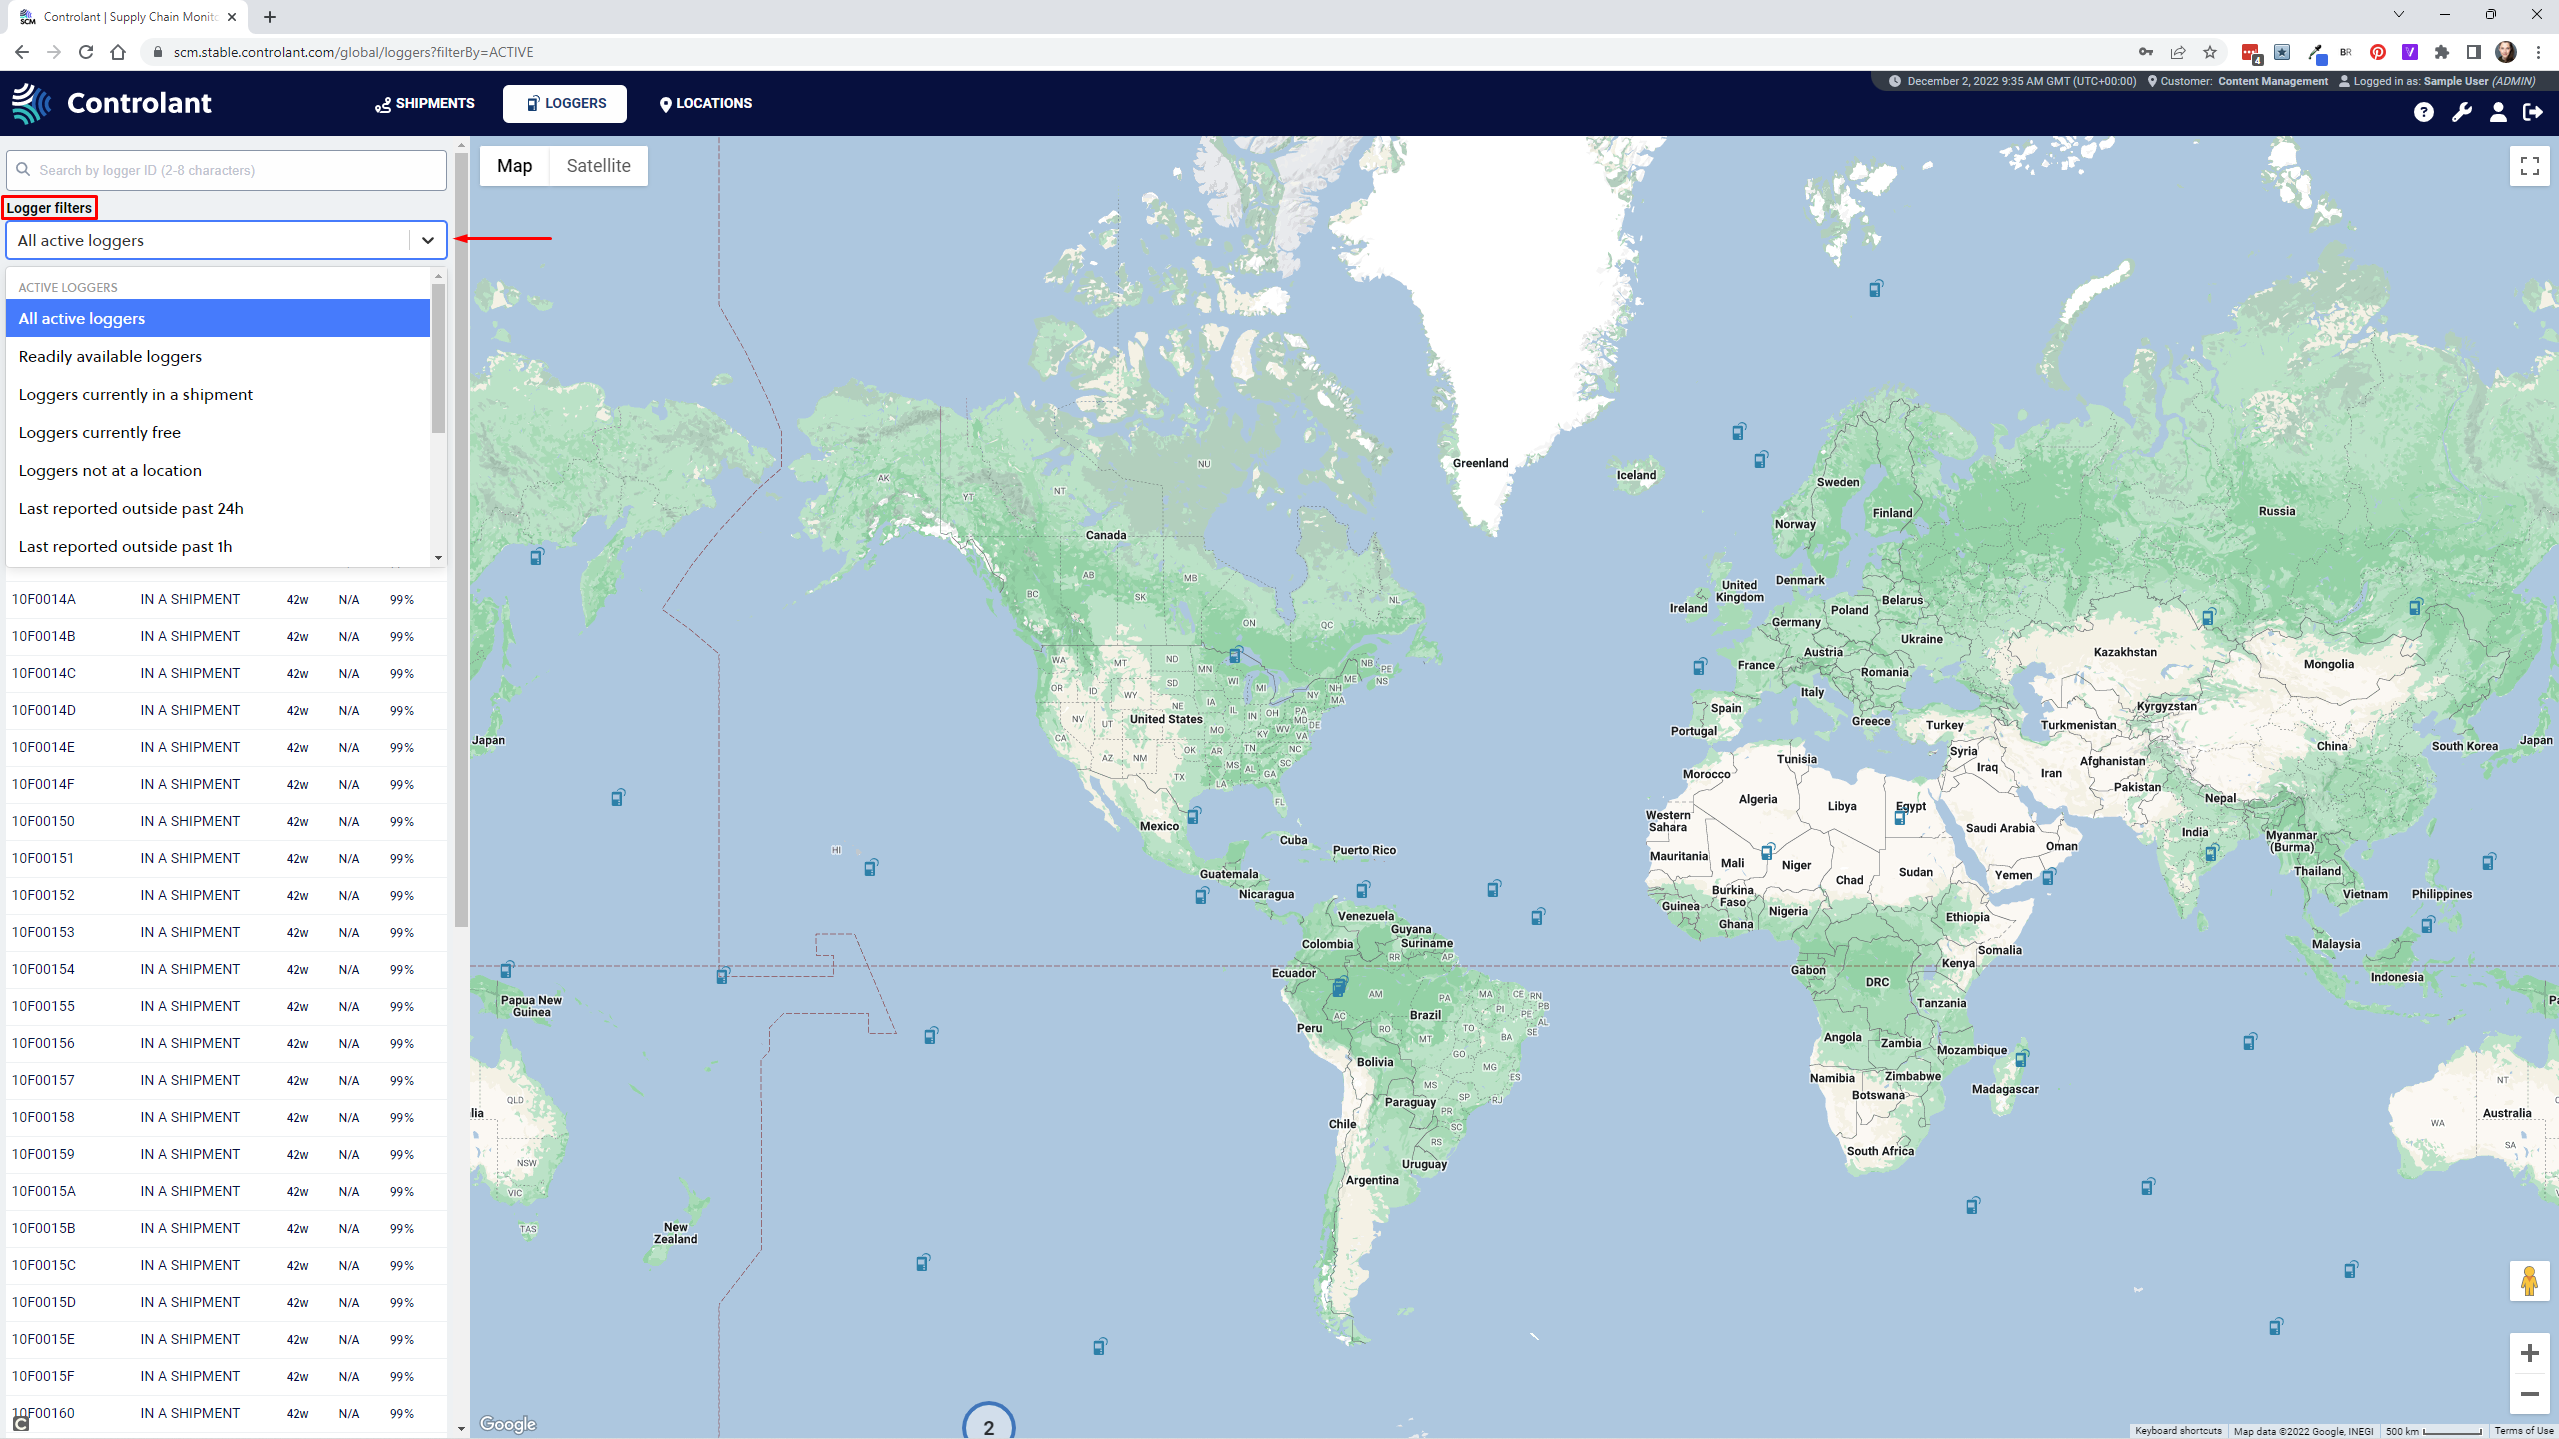
There are three ways to filter loggers in the loggers view with the search field , the logger filters drop-down menu, and a drop-down location list . The location filter is available with all the logger filters except Loggers not at a location.
The search field searches for the logger ID in the logger list, while the location drop-down list filters loggers by their last known location. The logger filters offer 11 different ways to filter the logger list. By default, the logger list is filtered by All active loggers. The other ten filters are as follows: Readily available loggers (free loggers, 75% battery charge or higher and have sent data in the last 48 hours), Loggers currently in a shipment, Loggers currently free, Loggers not at a location, Last reported outside past 24h (sent data more than 24 hours ago), Last reported outside one hour (sent data more than one hour ago), Last reported within 24h (sent data less than 24 hours ago), Last reported within past one hour (sent data less than one hour ago), All disabled loggers (disabled loggers are inactive and can only be viewed with this filter), and All recalled loggers (recalled loggers are inactive and can only be viewed with this filter).
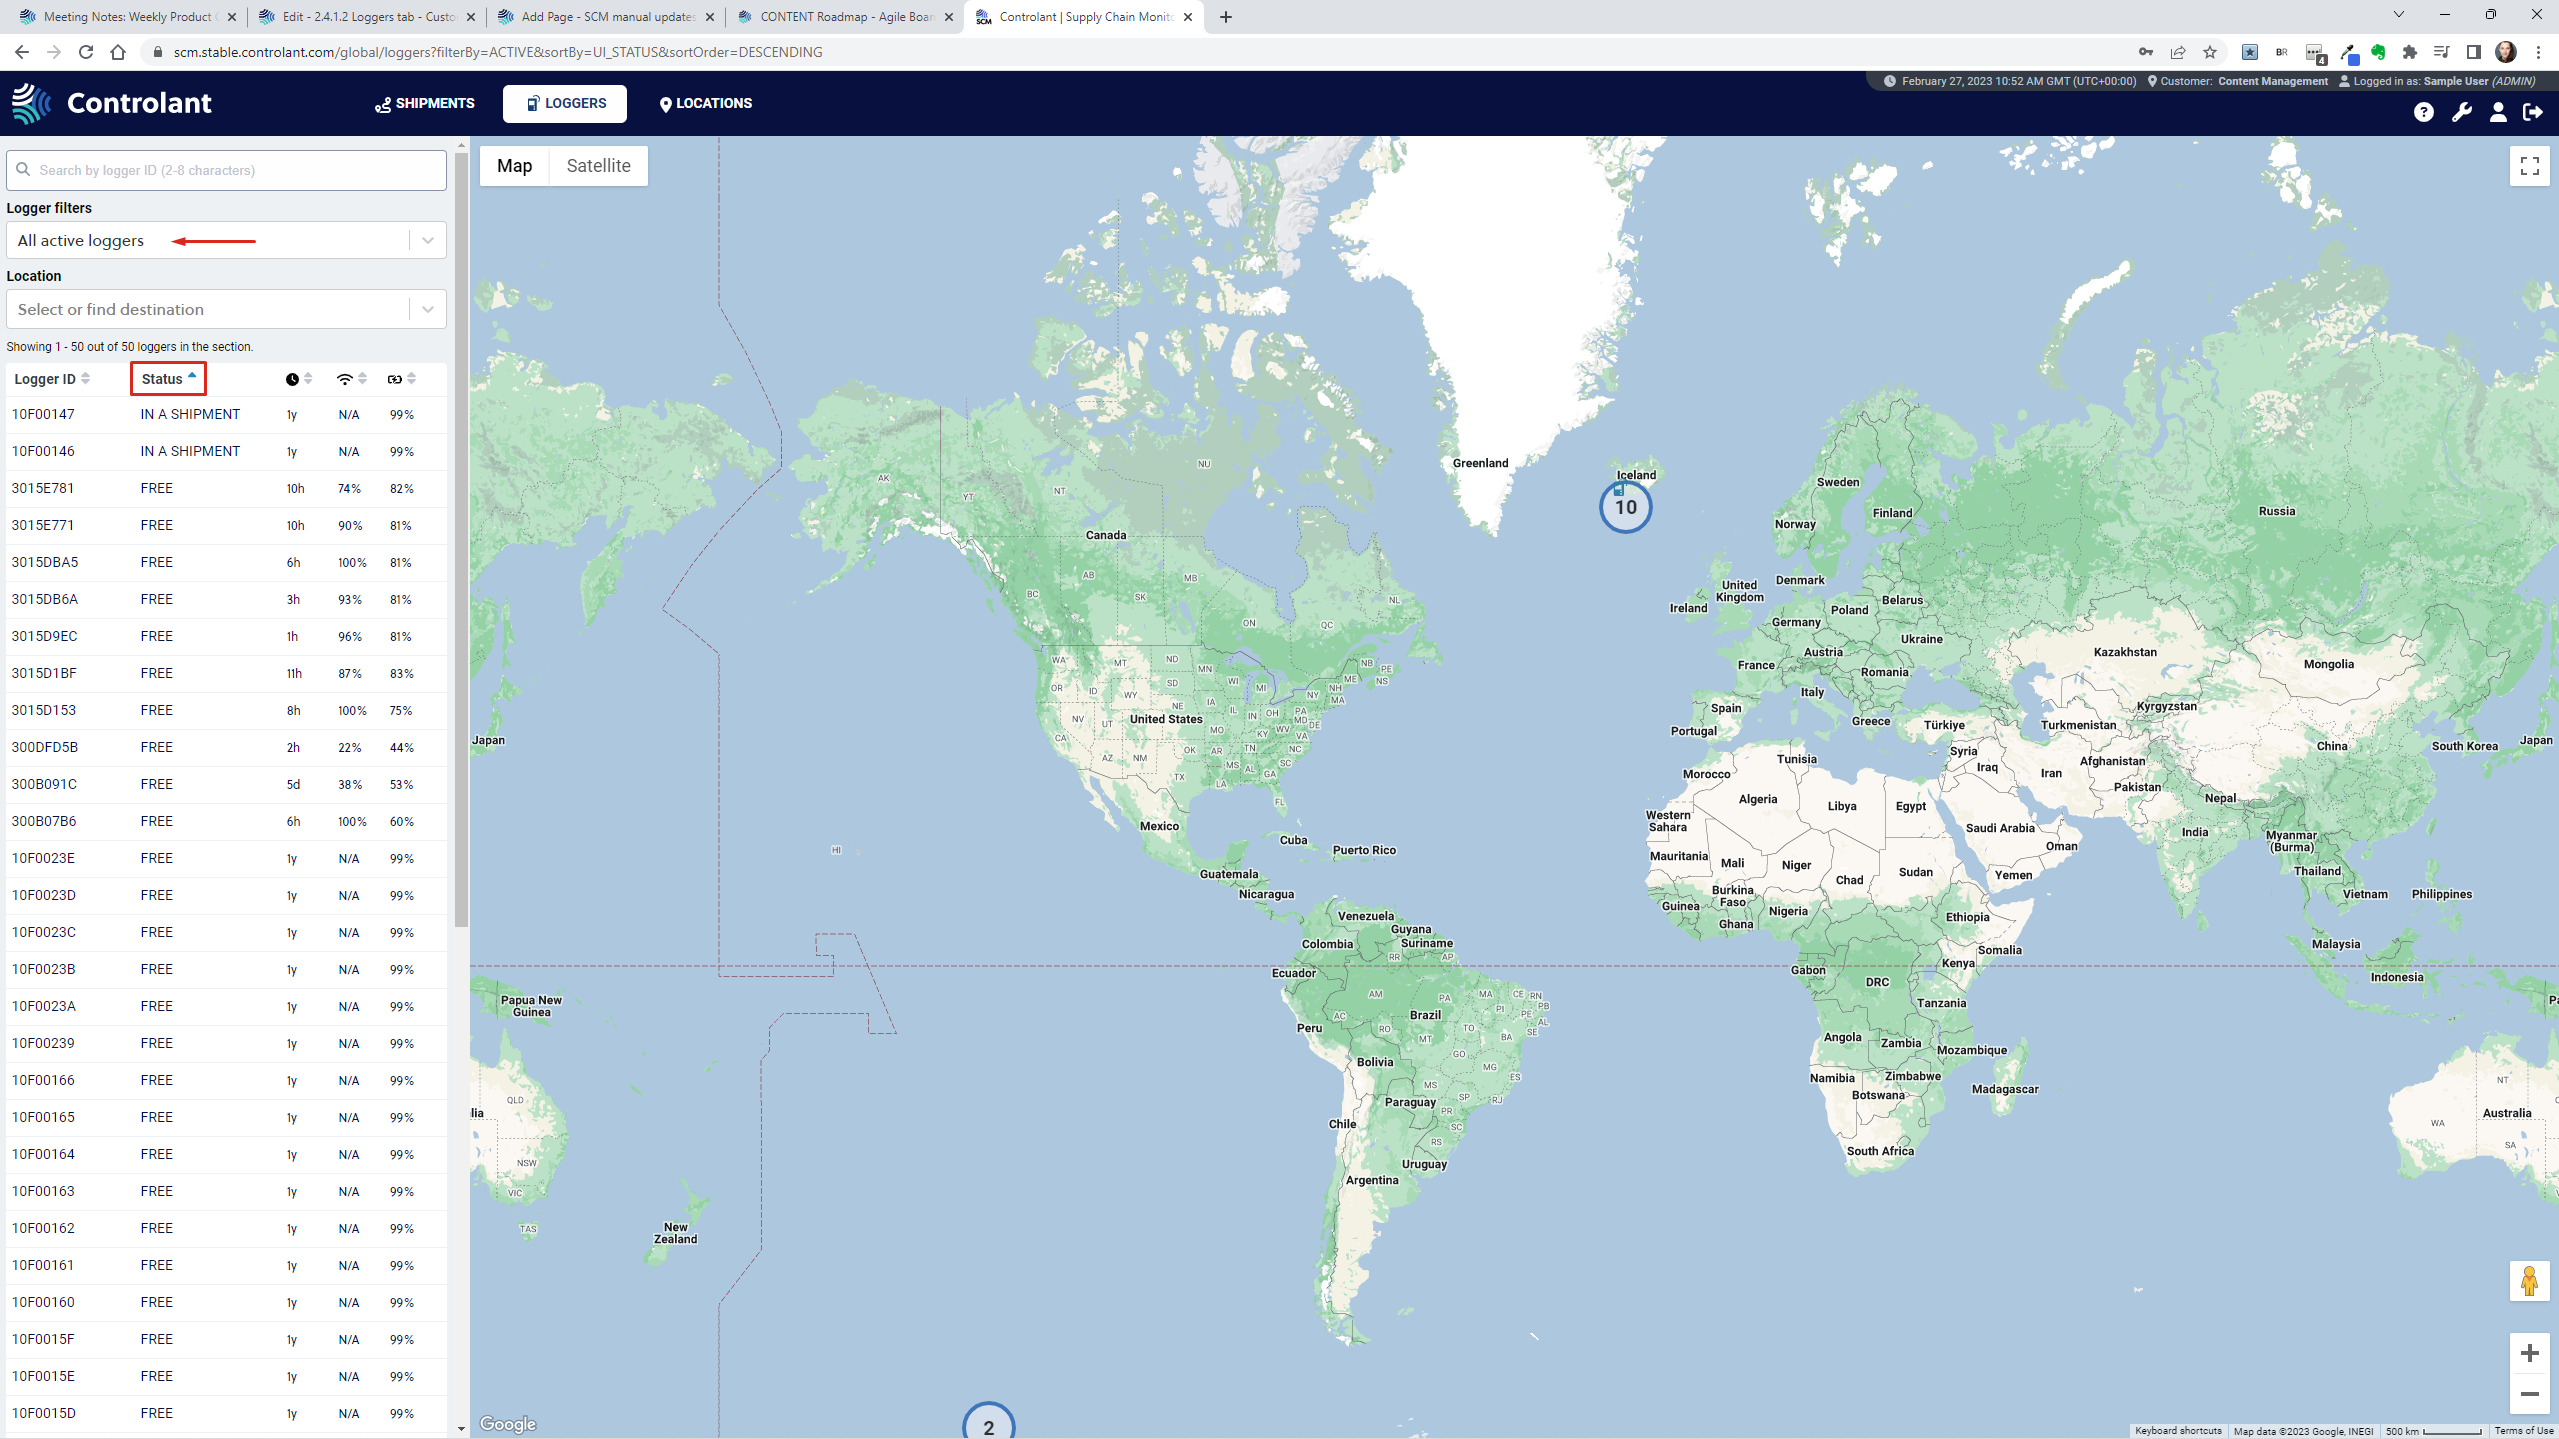
The loggers' table can be ordered by clicking on any headers in the table. Clicking each header will arrange the table by that header, and the whole loggers' table will be set, so the table stays in order, even when jumping between pages. The first click arranges the table in ascending order. The headers will be arranged in descending order on the second click, and the third click will revert the table to the original order. The second picture below shows the loggers table ordered in descending order by STATUS.
 |
 |
Logger Event Types
In a single logger view, under the info tab, all logger events that occur are displayed below the event Log. Below are all events listed and explained.
Button Pushed
Either the Start or Stop button was pushed during the shipment (only applies to older shipments).
Start Button Pushed
The start button was pushed during the shipment.
Stop Button Pushed
The stop button was pushed during the shipment.